


Wipro prints things most companies leave out: eight quarters of guidance against actuals, a 28.5% fall in its share price, and an admission that its own environmental cost number is probably too high. Then a key ratios table gives interest cover as 0.38 times and calls it favourable.
In this article
 In short
Key takeaways
- A 'Guided Outlook Versus Actuals' table (p. 50) sets eight quarters of revenue guidance next to what Wipro delivered. Revenue landed inside the range in seven quarters and above it once. Few Indian companies publish this in the annual report.
- The highlights page (p. 31) prints the share price at ₹187.64, down 28.5%. It also shows a 17.2% 'IT Services Operating Margin' that rose 0.2%, while the consolidated operating margin fell from 16.98% to 16.30% (p. 46). The definition of the headline margin is a footnote 40 pages later (p. 71).
- The key ratios table (p. 71) gives interest cover as 0.38 times, against 10.24 the year before, and marks the change favourable. Wipro's own operating income and finance costs (pp. 46, 48) give about 10.4 times, so a digit has gone missing.
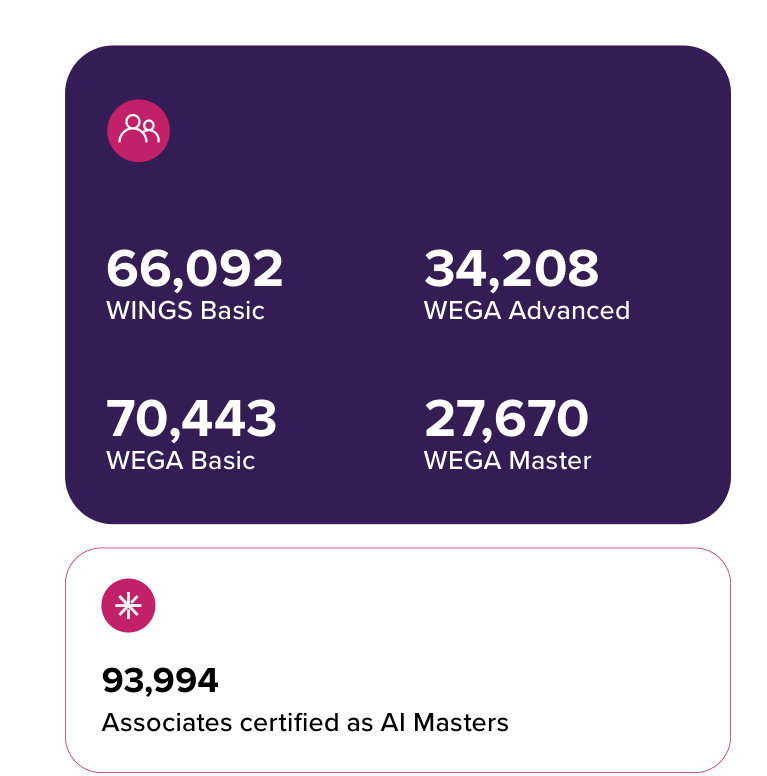
- The share of advanced AI skills is given five ways: 76% of employees (Chairman, p. 37), 85,219 people (pp. 54, 67), 93,994 'AI Masters' (pp. 96, 110), 34,208 WEGA Advanced and 27,670 WEGA Master (p. 110).
- The natural capital valuation rose to $510 million from $270 million, but Wipro says on page 59 that the new number is probably overstated. On a like-for-like basis the figure fell 22% to $210 million.
- The risk section still says Labour Code costs will come 'once the effective date is notified' (p. 121). The codes took effect in November 2025, and the same report books a ₹2,756 million charge for them (p. 51).
Official report: Get the Wipro Integrated Annual Report 2025-26 from the company's website. This page is The Footnotes' independent review of it.
Verdict: Wipro is willing to print what most reports leave out, but it doesn't check the result carefully enough. It publishes guidance against actuals, a falling share price, a shrinking list of its biggest clients and a frank note on the limits of its own environmental numbers. It also prints a ratio table with a missing digit, five versions of its AI-skills number and a risk page written before the Labour Codes took effect. Score: 26 of 35.
Page numbers below are the printed numbers on the report's pages, not PDF page counts. The PDF has 548 pages but 574 printed page numbers, because the opening section, up to page 55, is laid out as two-page spreads. The integrated report runs to page 121. The Board's report starts at page 122, the financial statements at page 188 and the BRSR at page 514. This is Wipro's 11th integrated report (p. 1), and it credits Stirrup for concept, content and design. Screenshots are small excerpts reproduced for review and remain the copyright of Wipro Limited.
The bad numbers are on the highlights page (p. 31)
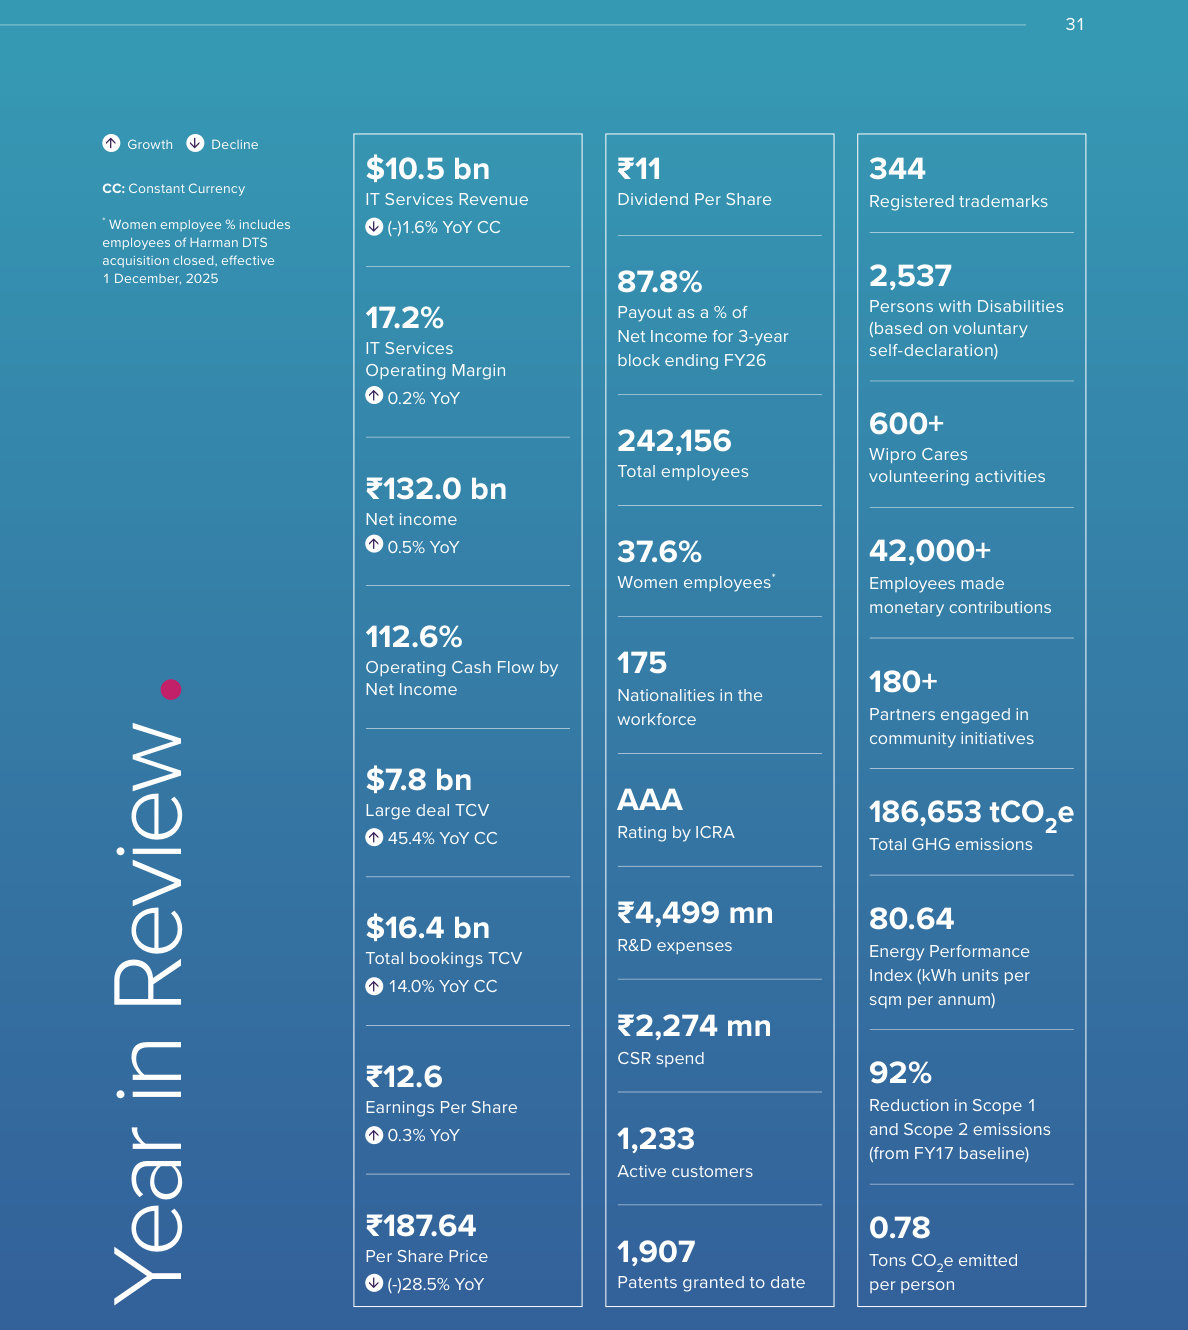
Wipro's "Year in Review" panel uses up and down arrows, and it uses the down arrows. IT Services revenue of $10.5 billion is marked down 1.6% in constant currency. The share price, ₹187.64 at 31 March 2026, is marked down 28.5%. Both sit on the same panel as the good news: large-deal bookings of $7.8 billion, up 45.4%, and total bookings of $16.4 billion, up 14.0%.
Both letters repeat the revenue decline rather than talking around it. The Chairman, Rishad Premji, opens his review of the year with it (p. 36). The CEO, Srinivas Pallia, gives it under a heading that reads "Performance Reflects Transition" (p. 39), and adds the detail behind the bookings: 64 large deals, four of them above $500 million.
One tile needs a warning label it doesn't have. "IT Services Operating Margin 17.2%, up 0.2%" is the segment result. It leaves out ₹7,954 million of "reconciling items", mainly ₹5,139 million of restructuring costs and ₹2,756 million for India's new Labour Codes (p. 51). On a consolidated basis the operating margin fell 68 basis points, from 16.98% to 16.30% (pp. 46, 48). Both numbers are in the report, but the highlights page shows only the one that rose. Its definition is footnote 1 on page 71, forty pages later.
Guidance against actuals, and a shrinking top tier (pp. 50-51)
- 7 of 8Inside the range
Revenue landed within the guided range in seven quarters.
- 1 of 8Above the range
Q3 FY25 exceeded the upper bound. The review flags an inconsistent sign in the table’s last column.
Clients contributing more than $100 million a year
Over the same two years, the largest client’s share of IT Services revenue rose from 3.0% to 4.6%.
Source — Wipro Integrated Annual Report 2025–26, p. 50, as cited in this review. Guidance outcomes follow the review’s reading of the guided-currency figures.
This spread is the most useful thing in the report for an investor, and the hardest to find in other Indian annual reports.
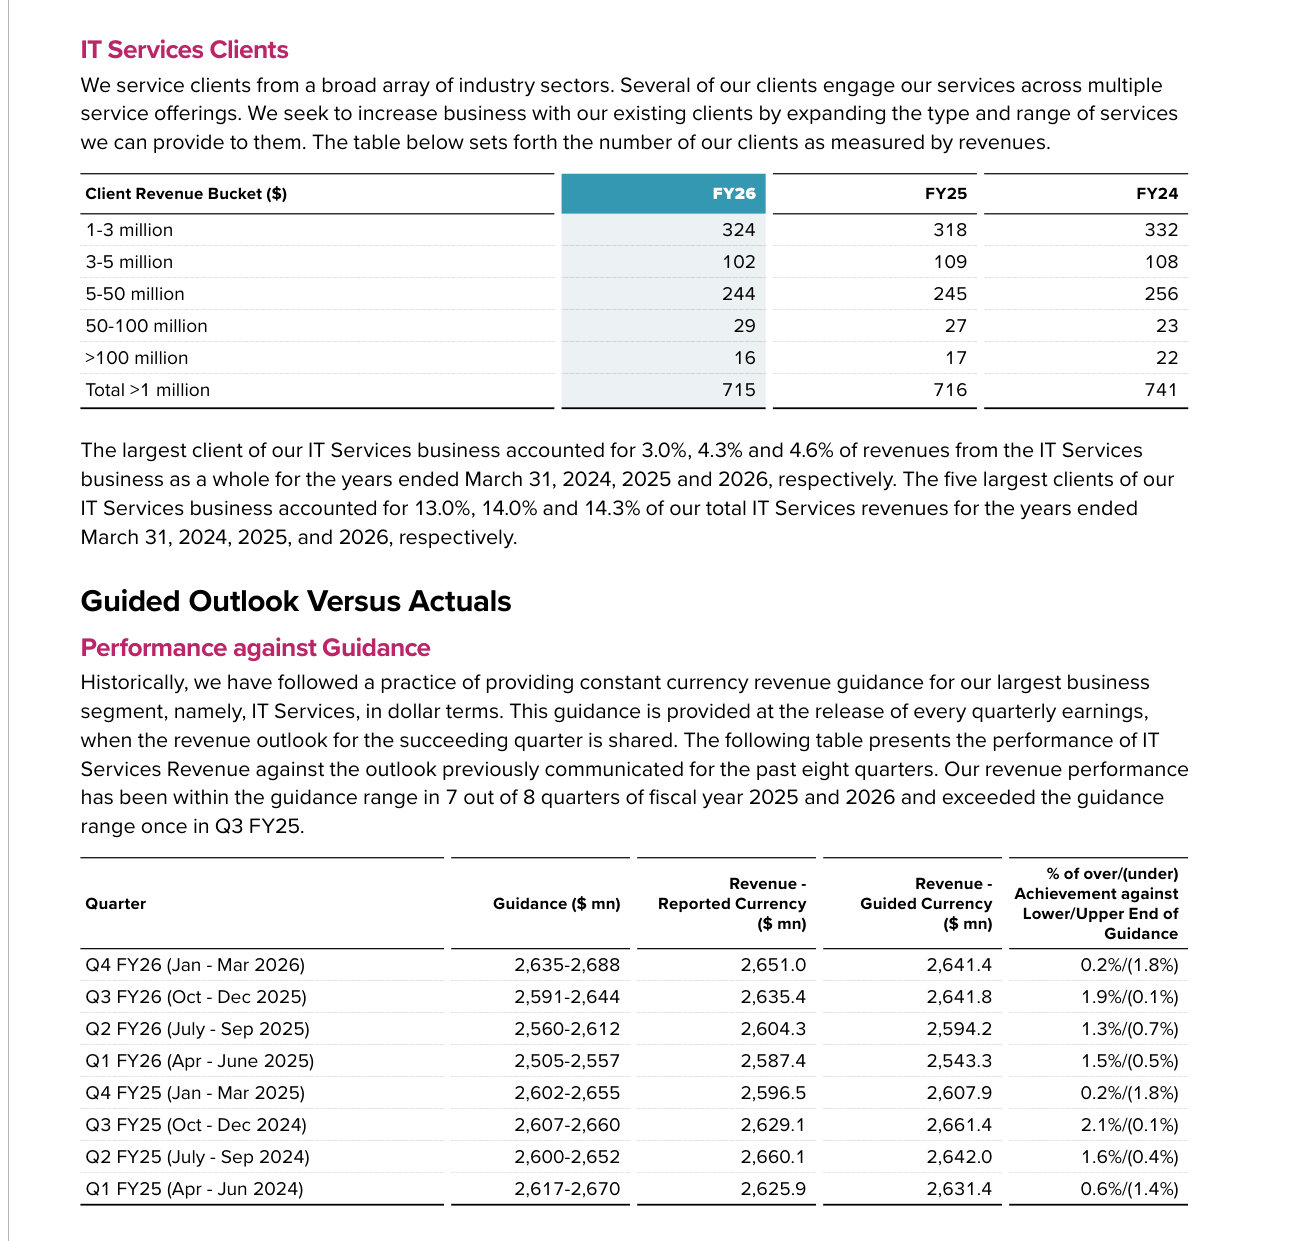
Guidance against actuals. Wipro gives quarterly revenue guidance for IT Services in constant currency. The table (p. 50) lists eight quarters of it, with the range, the revenue in reported and guided currency, and how far the result was from each end of the range. Revenue landed inside the range seven times and above it once, in Q3 FY25. A shareholder can judge how far to trust next quarter's guidance without digging through eight earnings releases.
There is one slip. The text says Q3 FY25 exceeded the range. The table's last column shows it 0.1% under the top end. The guided-currency figure, $2,661.4 million against a ceiling of $2,660 million, supports the text, so the sign in the column is wrong.
Client concentration. The client table directly above shows that Wipro had 22 clients paying more than $100 million a year in fiscal 2024, 17 in fiscal 2025 and 16 in fiscal 2026. At the same time, the largest client grew from 3.0% to 4.6% of IT Services revenue, and the top five from 13.0% to 14.3%. Fewer very large accounts, but more weight on the biggest one. The report gives these numbers but doesn't comment on them. It should, because "Building Large Accounts" is the first of Wipro's five strategic priorities (p. 42).
A ratio table nobody checked (p. 71)
The Investor Returns section opens well. It states the capital allocation policy (return 70% or more of net income over three years), reports a payout of 87.8% for the three years to fiscal 2026 (p. 71), and gives the ₹150 billion buyback in full: up to 600 million shares, 5.7% of paid-up capital, at ₹250 each by tender offer, approved by the Board on 16 April 2026 (p. 70).
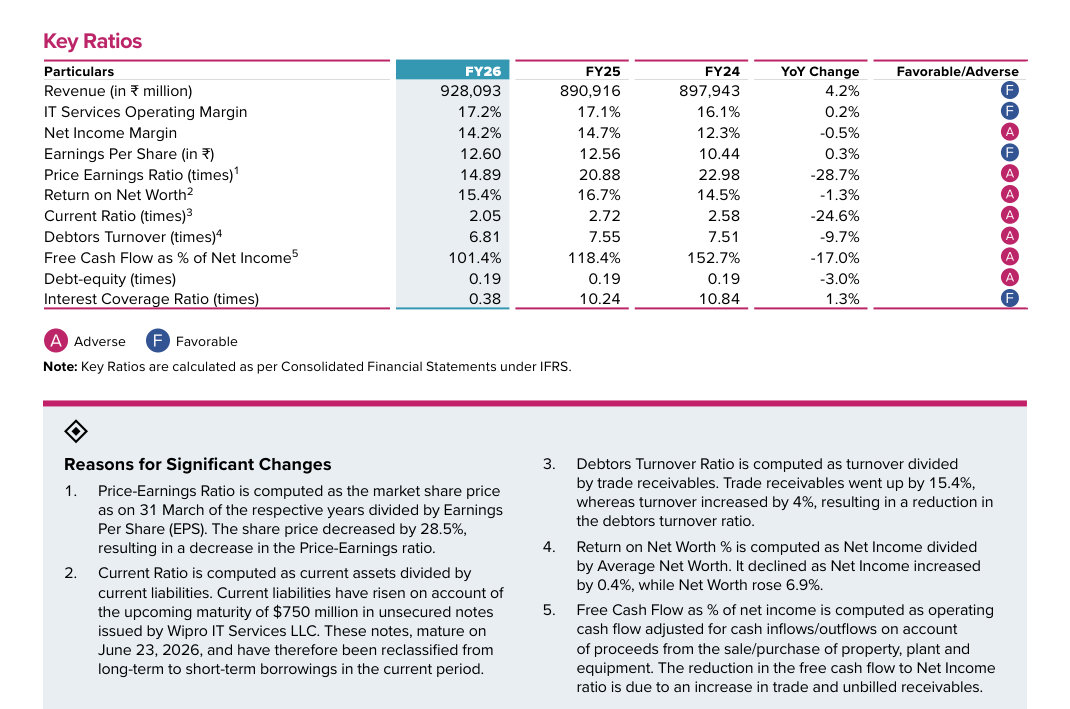
The Key Ratios table on the next page has three errors a careful reader will catch:
- Interest coverage is printed as 0.38 times, against 10.24 a year earlier, with a change of "+1.3%" and a blue "favourable" marker. An interest cover of 0.38 would mean Wipro can't pay its interest out of operating profit. Its operating income of ₹151,251 million (p. 46) divided by finance expenses of ₹14,577 million (p. 48) is about 10.4. The "1" has dropped off.
- Debt-to-equity is 0.19 in all three years, down 3.0%, and marked "adverse". Less debt relative to equity is not adverse.
- The footnotes are mismatched. The superscripts number Return on Net Worth 2, Current Ratio 3 and Debtors Turnover 4. The explanations below number Current Ratio 2, Debtors Turnover 3 and Return on Net Worth 4.
The explanations themselves are good. They say the current ratio fell because $750 million of notes due on 23 June 2026 moved into short-term borrowings, and that trade receivables rose 15.4% while revenue rose 4%. That second point also explains why free cash flow fell to 101.4% of net income from 118.4%. That is the kind of detail a ratio table should give. It makes the errors around it more visible.
Five ways to count AI skills
The report's argument is that Wipro is becoming an AI-first company, and its main evidence is its people. The trouble is that the numbers don't agree with each other:
- The Chairman says "76% of employees have completed advanced AI training through more than 90 role-based pathways" (p. 37). With 242,156 employees, that is about 184,000 people.
- The value creation model gives 85,219 "AI Aware employees/associates acquired Advanced AI skills" (p. 54). The materiality page repeats 85,219, and adds that 93,994 "acquired Master AI skills" (p. 67), so more people hold the master level than the advanced level.
- The People section shows 34,208 WEGA Advanced and 27,670 WEGA Master certifications, with 93,994 "certified as AI Masters" in the box beneath (p. 110).
- The MD&A counts more than 180 AI learning pathways (p. 44), not 90.
- The CEO's 212,000 "employees enabled" (p. 39) matches the 212,663 "covered through AI-ready workforce initiatives" (pp. 55, 109), which is a different measure again.
Each number may be correct for what it counts. But no page explains how they relate, and the Chairman's 76% can't be reconciled with any of them. For a company whose cover line is "proof over promise" (p. 3), this is where the proof should be tight.
There is also no AI revenue figure anywhere in the integrated section. Infosys gives one (5.5% of revenue from its AI-first areas in one quarter). Wipro gives client case studies with percentages, such as a 90% cut in contract processing time for an energy services company (p. 10), but not the size of the business.
A value creation model with numbers, and outcomes without them (pp. 54-55)
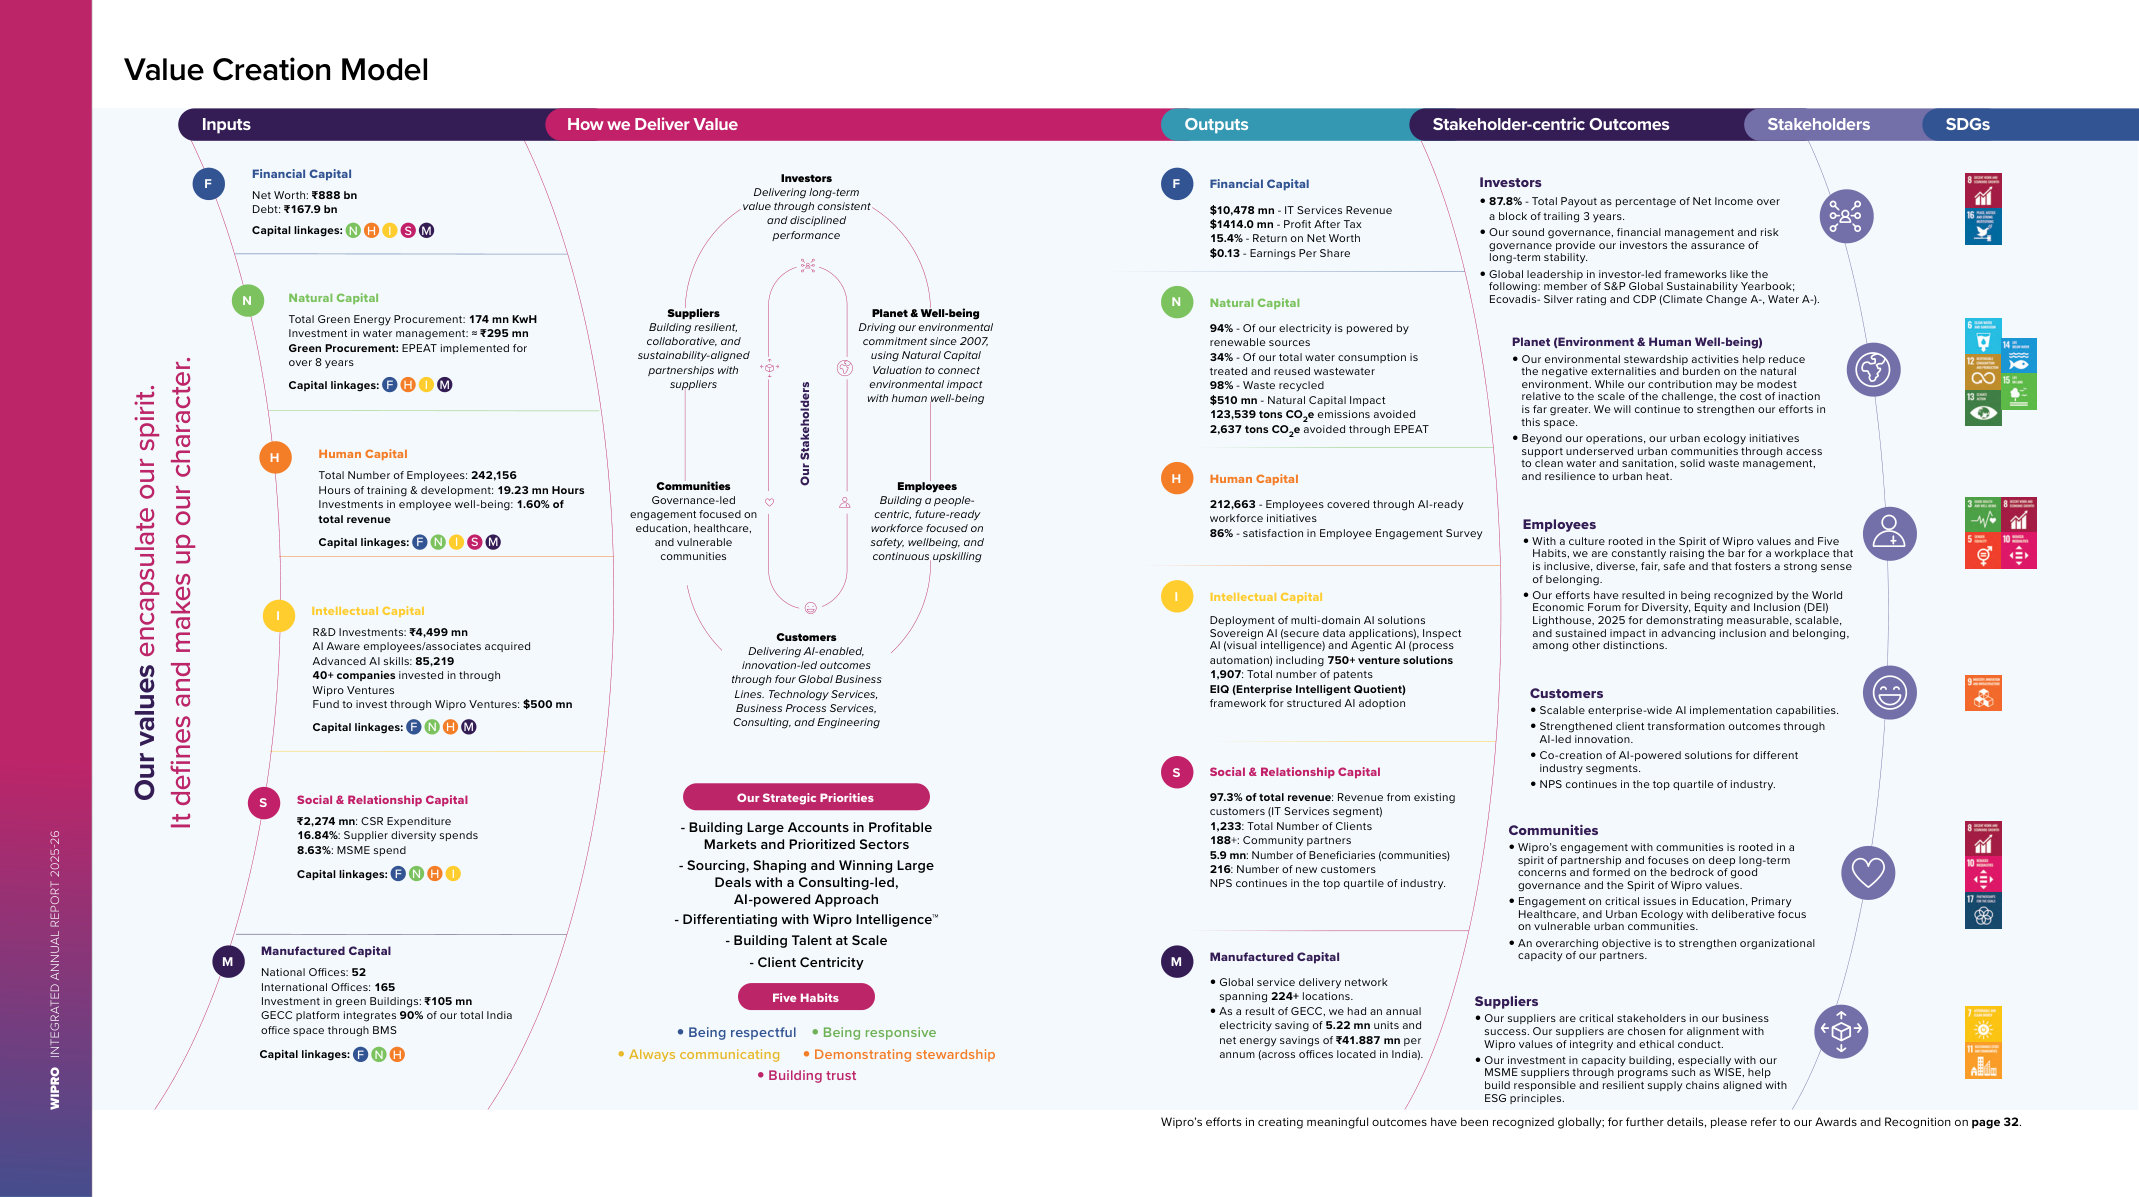
The inputs and outputs columns are numeric for every capital: net worth of ₹888 billion and debt of ₹167.9 billion in; $10,478 million of IT Services revenue and 15.4% return on net worth out. 19.23 million training hours in; 86% engagement score out. The centre shows Wipro's current five strategic priorities, the same five the MD&A uses (p. 42), so the model reflects this year's strategy.
The outcomes column is weaker. Customer outcomes are "Scalable enterprise-wide AI implementation capabilities" and "NPS continues in the top quartile of industry", without an NPS figure here or in the customer section (p. 96). The whole spread is also set in very small type, readable on a large screen but not in print or on a phone. (Our guide to value creation models in Indian integrated reports shows what a measured outcomes column looks like.)
The model also uses numbers that differ elsewhere in the report. It gives MSME spend as 8.63% (p. 54); the materiality page says 8.4% (p. 67).
An environmental cost number Wipro says is too high (pp. 56-59)
- $270mPrior year
The comparison figure before the newly added purchase category.
- $510mCurrent headline
Includes a new category of purchases without purchase orders. Wipro says this probably overstates the impact.
- $210mCurrent like-for-like
Excludes that new category. Around 22% below the prior year’s $270 million.
Source — Wipro Integrated Annual Report 2025–26, pp. 56–59, as cited in this review. These are environmental impact valuations, not cash expenditure. The two current-year figures use different coverage.
Wipro has put a money value on its environmental impact since 2016. This year the number almost doubled, to $510 million from $270 million (p. 57), and 99% of it sits in the supply chain.
Page 59 explains why, and it is the most candid page of sustainability reporting in this year's Indian reports. Wipro added a large category of purchases made without purchase orders, about 50% of its total purchased value, which it couldn't classify by material. It says outright that this probably overstates the impact. Air pollution makes up 81% of the total, which it calls typical of construction materials and electronics but not of services. It then gives the like-for-like comparison without the new category. On that basis the valuation fell 22%, to $210 million. Very few companies tell readers their own headline number is probably wrong and then show the better one.
A dashboard that keeps the bad years (pp. 74-78)
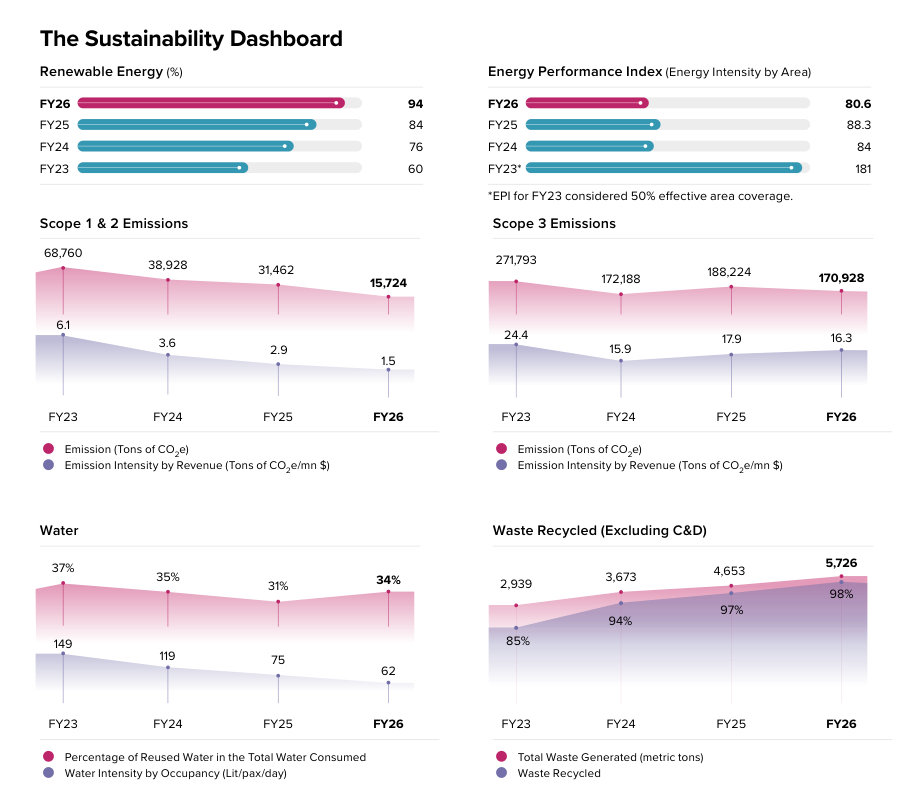
The dashboard shows four years of each metric, not just the latest one. Some of the lines don't improve:
- Scope 1 and 2 fell from 68,760 to 15,724 tCO2e between fiscal 2023 and 2026. Against the 2017 baseline that is a 92% cut, well past the 2030 target of 59% (p. 76). Renewables are now 94% of electricity.
- Scope 3 went from 172,188 tCO2e in fiscal 2024 to 188,224 and then 170,928. That is roughly flat over two years, and Scope 3 is 92% of the footprint (p. 77). The target page claims a 65% cut against a 55% target for 2030, with a note, "SBTi approved top 3 categories". So the 65% covers three categories, not all of Scope 3. That should be stated in the headline, not in a footnote.
- Reused water has slipped from 37% of consumption in fiscal 2023 to 34%, against a target of 45% by 2030 (p. 78).
- Waste generated nearly doubled, from 2,939 to 5,726 tonnes, while the recycled share rose to 98%.
The Scope 3 table (p. 77) names employee commuting as the largest category, at 66,253 tCO2e, and the text admits the fleet-electrification deadline "has moved" to 2035.
Assurance is solid. Deloitte Haskins & Sells LLP gives reasonable assurance on BRSR Core (report dated 13 June 2026, p. 562) and limited assurance on other selected indicators. Two things hold the ESG score at 4. The materiality page says a double materiality assessment aligned with European standards was done "during the year", then shows the outcomes of the 2023 exercise instead (p. 65). And the BRSR boundary leaves out the HARMAN Digital Transformation Solutions business acquired in the year (p. 515), while the highlights page includes its employees in the 37.6% women figure (p. 31).
Text carried over from earlier years (pp. 112-121)
The risk section has three pieces of old text:
- The Labour Codes. Under wage pressure, page 121 says Wipro "may also experience increased costs in future years… once the effective date is notified". The codes took effect in November 2025, and page 51 of the same report books ₹2,756 million for their impact.
- An older strategy. The risk framework diagram (p. 113) lists Wipro's strategic objectives as "Accelerate Growth", "Strengthen Client and Partnerships", "Lead with Business Solutions", "Built Talent at Scale" and "Simplified Operating Model". Those aren't the five priorities used everywhere else in the report (pp. 2, 42).
- Old evidence. The case that Wipro manages risk well rests on a Gartner rating from August 2024 and a PwC benchmark from late 2023 (p. 112).
Governance disclosure is better than in most reports. The board evaluation (p. 130) says what the review found and what will change: deeper discussion of long-term business models, more risk discussion at Board level, and less time on presentations. The pay disclosure (p. 139) gives the CEO's pay at 524 times the median employee, down 7%, and footnotes explain why both executive directors' pay fell. Against that, there is no statement that the Board takes responsibility for the integrated report. And the Board page (pp. 34-35) shows the eight current directors but describes the nine-member Board that existed until 31 March 2026 in its composition box.
On the digital side, Wipro publishes an online edition, and the PDF's contents page, home icons and section tabs link back to the contents and section openers. But the 548-page PDF has no bookmarks, and its first 28 pages are spreads, which are awkward on a phone.
What other companies can copy
- Publish guidance against actuals (p. 50). Eight quarters, range, result and the distance from each end. It costs one table and settles the question of how far to trust the next forecast.
- Put the share price fall on the highlights page (p. 31). If the report prints it, readers are more likely to trust the other numbers on the page.
- Say when your own number is probably wrong, then give the better one (p. 59). The like-for-like natural capital figure is more useful than the headline.
- Show four years on the sustainability dashboard, including the lines that went the wrong way (p. 74).
- Report what the board evaluation found (p. 130), not just how it was run.
And what not to copy: a headline margin defined forty pages after it appears, a ratio table nobody re-added, one claim counted five ways, and a risk section that hasn't been updated for the year's own events. For how the cover compares with other reports this year, see annual report covers compared.
The score
- Strategy and narrative3 / 5
- Integrated thinking and capitals4 / 5
- BRSR and ESG integration4 / 5
- Governance disclosure4 / 5
- Financial storytelling4 / 5
- Design and readability3 / 5
- Digital version4 / 5
Seven criteria, each out of five. Scores assess reporting quality. The review’s reasons appear in the table below.
| Criterion | Score (of 5) | Why |
|---|---|---|
| Strategy and narrative | 3 | Frank letters and five clear priorities; no measurable goals, inconsistent AI-skills evidence, and an older strategy in the risk framework |
| Integrated thinking and the capitals | 4 | Numeric inputs and outputs for every capital and a natural capital valuation with its limits explained; outcomes stay qualitative |
| BRSR and ESG integration | 4 | Reasonable assurance on Core, SBTi targets with performance, four-year dashboard; new materiality results not shown, BRSR boundary excludes the acquisition |
| Governance disclosure | 4 | Board evaluation findings and actions, explained pay ratios; no Board responsibility statement for the integrated report |
| Financial storytelling | 4 | Guidance against actuals, client concentration and the share price fall; headline margin undefined where it appears, errors in the key ratios table |
| Design and readability | 3 | Consistent design system, but 574 printed pages, spreads mixed with single pages and a value creation model in very small type |
| Digital version | 4 | Online edition and linked contents, home icons and section tabs; no PDF bookmarks |
| Total | 26 / 35 |
How it compares
Every review on The Footnotes uses the same seven-point card, so scores can be compared. Scores are editorial opinion of the published document.
| Company | Score (of 35) |
|---|---|
| Hindustan Zinc | 30 |
| HUL | 28 |
| TCS | 28 |
| Bharti Airtel | 27 |
| L&T | 27 |
| Reliance | 27 |
| HDFC Bank | 26 |
| Wipro (this review) | 26 |
| Asian Paints | 25 |
| ICICI Bank | 25 |
| Infosys | 25 |
| LTM | 25 |
| Tata Steel | 25 |
| Mahindra & Mahindra | 24 |
| Titan | 23 |
| Adani Ports | 22 |
| ITC | 21 |
| SBI | 21 |
| Sun Pharma | 21 |
| Bajaj Finance | 20 |
| NTPC | 20 |
Frequently asked questions
How long is Wipro's 2025-26 annual report?
The PDF has 548 pages, which carry 574 printed page numbers because the opening section, up to page 55, is laid out as two-page spreads. The integrated report runs from page 1 to page 121. The Board's report starts at page 122, the corporate governance report at page 158, the financial statements at page 188 (standalone and consolidated under Ind AS, then consolidated under IFRS) and the BRSR at page 514.
What does 'IT Services Operating Margin' mean in Wipro's report?
It is the IT Services segment result as a share of segment revenue: 17.2% in fiscal 2026 against 17.1% a year earlier. It leaves out 'reconciling items' of ₹7,954 million, mainly ₹5,139 million of restructuring costs and ₹2,756 million for the new Labour Codes (p. 51). The consolidated operating margin, which includes them, fell from 16.98% to 16.30% (p. 46). The definition is footnote 1 on page 71.
How big is Wipro's 2026 buyback?
On 16 April 2026 the Board approved a buyback of up to 600,000,000 equity shares, 5.7% of paid-up capital, at ₹250 a share through a tender offer, for up to ₹150,000 million ($1,599 million), subject to shareholder approval by postal ballot (p. 70). The Chairman calls it Wipro's largest buyback (p. 36).
What are Wipro's emissions and climate targets?
Wipro reports a 92% cut in Scope 1 and 2 emissions from its 2017 baseline, against a 2030 target of 59%, and 94% renewable electricity (p. 76). Scope 3 emissions were 170,928 tCO2e in fiscal 2026 against 188,224 the year before (p. 77), and Scope 3 is 92% of its footprint. Its target is net zero across all three scopes by 2040.
Who assures Wipro's BRSR?
Deloitte Haskins & Sells LLP gives reasonable assurance on the BRSR Core indicators and limited assurance on selected other BRSR indicators. The reasonable assurance report is dated 13 June 2026 (p. 562). Deloitte is also Wipro's statutory auditor. The BRSR boundary excludes the HARMAN Digital Transformation Solutions business acquired during the year (p. 515).
How does The Footnotes score annual reports?
Seven criteria, each scored 1 to 5 with a one-line reason: strategy and narrative; integrated thinking and capitals; BRSR and ESG integration; governance disclosure; financial storytelling; design and readability; and the digital version. Scores are editorial opinion based on the published document, and the same card is used for every company so results can be compared.
Sources
- Wipro — Integrated Annual Report 2025-26 (PDF) — Wipro Limited
- Wipro — Integrated Annual Report 2025-26 (online edition) — Wipro Limited
- Integrated Reporting Framework (IFRS Foundation) — IFRS Foundation
- SEBI circular: BRSR Core — framework for assurance and ESG disclosures for value chain (12 July 2023) — SEBI