

Mahindra & Mahindra Integrated Annual Report 2025-26: A Review
Mahindra's Integrated Annual Report 2025-26 has one of the clearest strategy stories in this series: three phases, three sets of businesses, named exits and dated targets for each Growth Gem. The integrated section is a compact 93 pages. But materiality is described without a single topic, the emissions page shows absolute numbers rising without the intensity progress the BRSR reports, and four pages of awards come before the strategy.
 In short
Key takeaways
- The report runs to 487 printed pages plus a separately numbered 36-page AGM notice. The integrated section (pages 1 to 93) is organised around the Rise pillars: Rise to Create Value, Rise to be Future-Ready and Rise for a More Equal World, followed by the Board's report, MD&A, corporate governance report, BRSR and accounts.
- Strategy is told as three phases since FY21 (disciplined capital allocation, pivot to growth, deliver scale) across three sets of businesses: Auto and Farm, Mahindra Finance and Tech Mahindra, and twelve Growth Gems, each with a dated ambition such as Tech Mahindra's 15% EBIT margin by FY27 and Mahindra Lifespaces' ₹10,000 crore of sales by FY30.
- FY26 consolidated income from operations was ₹1,98,639 crore, up 25%, and PAT attributable to owners ₹17,099 crore, up 32%, with ROE of 20.1% and EPS of ₹152.2; the Board recommended a dividend of ₹33 a share, a payout of 26.2% of standalone profit.
- The Group Value Creation Model gives numeric inputs and outcomes for all six capitals across two pages, but the outcomes are mostly outputs (vehicles sold, launches) with no prior-year comparison, and the capitals do not structure the rest of the report.
- DNV Business Assurance India gives reasonable assurance on BRSR Core. The BRSR reports Scope 3 of 123.7 million tCO2e (94.5 million in FY25, with the rise attributed to wider coverage) and a 57% emissions reduction in the Auto sector from FY2018-19; the integrated section shows neither.
- The materiality page describes a double materiality approach but names no material topics and refers readers to the Sustainability Report; four pages of awards precede the strategy chapter, and the online FlippingBook edition is not mentioned in the PDF.
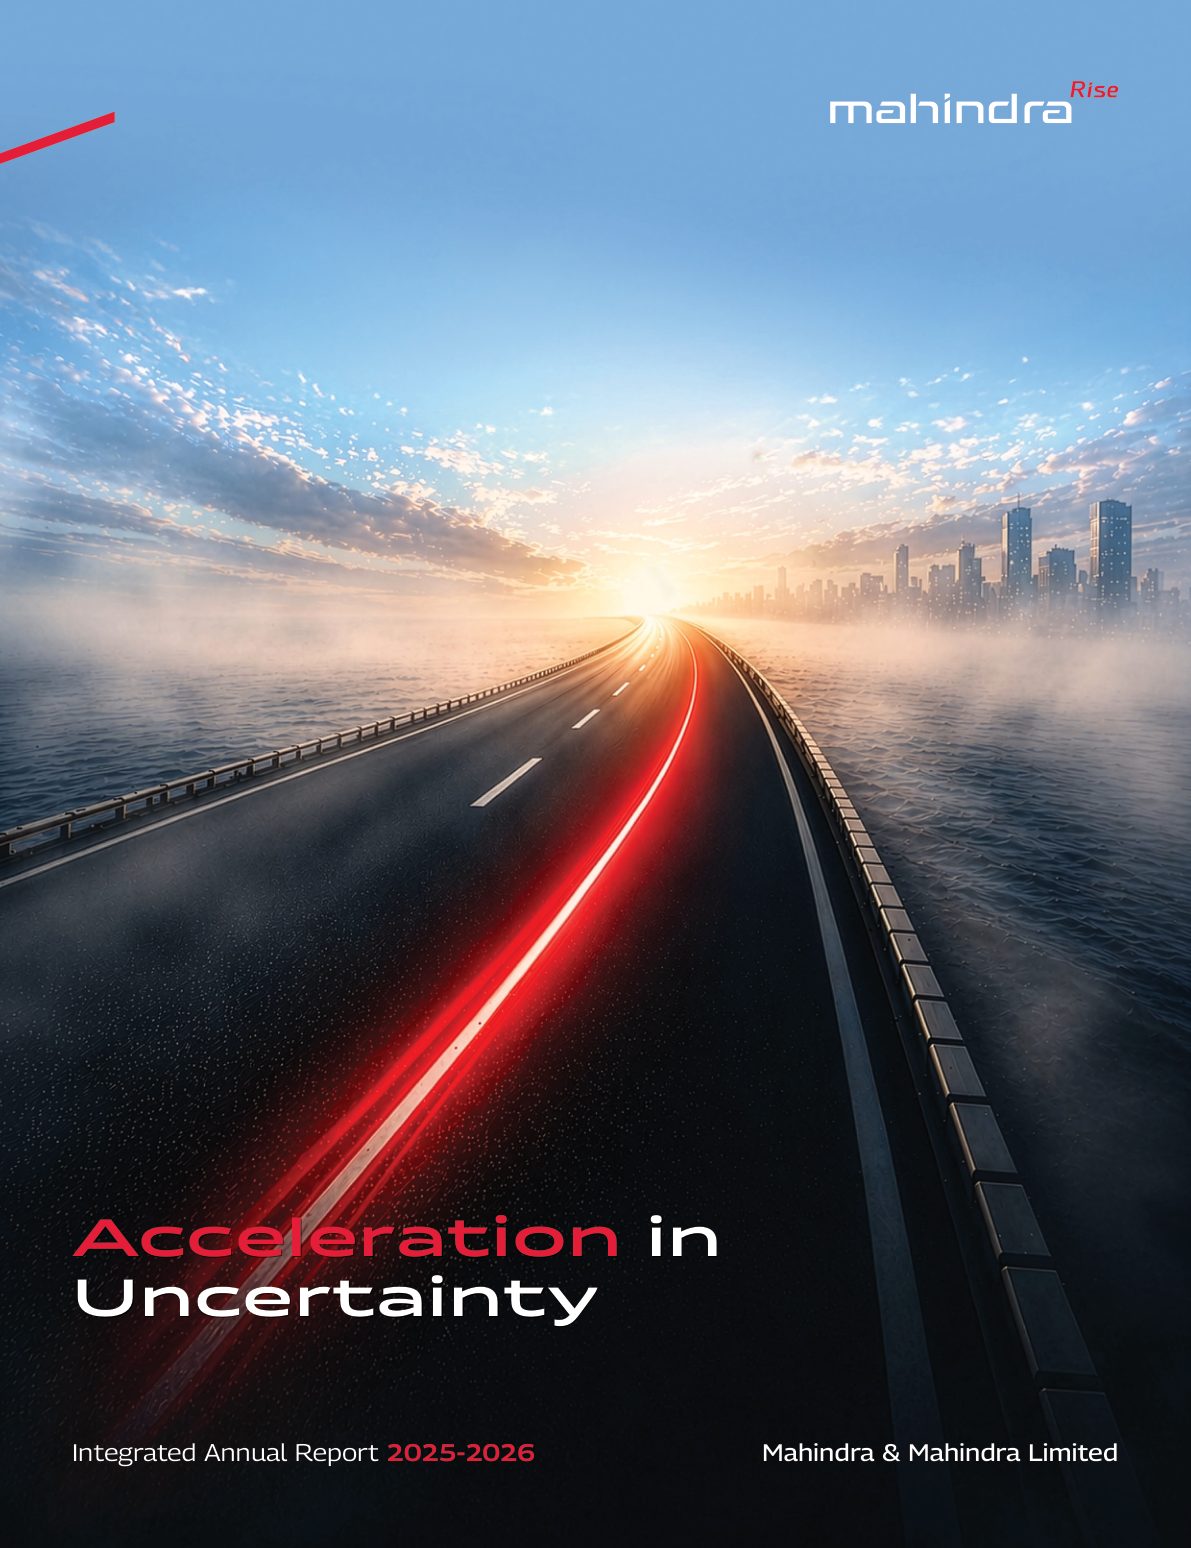
Mahindra & Mahindra had a record year to report in FY26: consolidated income from operations up 25%, profit up 32%, the highest-ever domestic tractor share and the top spot in electric SUVs by revenue. The report's theme, "Acceleration in Uncertainty", is set by a cover showing a red light trail on a fog-bound road, and the Chairman's letter picks it up with Formula E's Attack Mode. The strategy chapter behind it is one of the clearest in this series. The sustainability and governance scaffolding around it is thinner than the company's reputation for ESG leadership would suggest.
As with every review in this series, we read the published PDF against the <IR> Framework, SEBI's BRSR Core expectations and plain readability, and score it on the same seven-point card. Scores are our opinion. Screenshots are small excerpts reproduced for review and remain the copyright of Mahindra & Mahindra Limited; the full report is on the company's investor pages and as an online edition.
The scorecard
| Criterion | Score (of 5) | In one line |
|---|---|---|
| Strategy and narrative | 4 | A three-phase portfolio story with named exits and dated targets per business; the Chairman's letter is metaphor, and awards come first |
| Integrated thinking and the capitals | 3 | Numeric inputs and outcomes for all six capitals on one model; outcomes are outputs without comparatives, and the capitals stop there |
| BRSR and ESG integration | 3 | Reasonable assurance from DNV and full Scope 3 in the BRSR; materiality names no topics and the integrated section shows no progress against targets |
| Governance disclosure | 3 | Complete statutory disclosure with director skills; no Board statement of responsibility, and ESG oversight sits with an executive body |
| Financial storytelling | 3 | Record results stated plainly and ratios explained in the MD&A; highlights are two numbers and two unlabelled charts, with no multi-year table |
| Design and readability | 4 | A compact 93-page integrated section, one visual system, single pages; four pages of awards up front |
| Digital version | 4 | Bookmarked, hyperlinked contents, single pages, and a FlippingBook edition online that the PDF never mentions |
| Total | 24 / 35 |
What the report is
The report runs to 487 printed pages, followed by a separately numbered 36-page notice of the eightieth AGM. The integrated section occupies pages 1 to 93: leadership messages, performance highlights, a Group overview with the Board and Group Executive Board, then three chapters named for the Mahindra "Rise" pillars. Rise to Create Value holds the strategic overview, risk management and outlook; Rise to be Future-Ready covers manufacturing, digital and AI, and new products; Rise for a More Equal World covers ESG, people and social impact. The Group Value Creation Model sits between the first two. Statutory reports follow from page 94, with the BRSR from page 246, and the accounts from page 302.
The "About the Report" page (p. 6) says the company has been on the integrated reporting journey since FY17, that the report "draws reference from" the <IR> Framework, GRI and SEBI's BRSR guidelines, and that its scope is M&M's Automotive and Farm Equipment sectors plus highlights from Group businesses. It gives the period and the six capitals. It does not name an assurance provider for the integrated section or carry a statement from the Board about the report's integrity.
Key number: 3 — phases in the strategy story since FY21: disciplined capital allocation, pivot to growth, deliver scale.
Strategy and narrative: 4/5
The Group Strategic Overview (pp. 21 to 34) is the best thing in the report. It explains the portfolio as three phases. In FY21, businesses without "a clear right to win" were exited. From FY22 to FY24 the Group set a roadmap for three sets of businesses: capitalise on market leadership in Auto and Farm, bring Mahindra Finance and Tech Mahindra to full potential, and scale up the Growth Gems. From FY25 the task is delivering scale. The same page ties that to results: 25% revenue growth, 20% ROE and EPS of ₹152, a 57% compound annual rate since FY21.
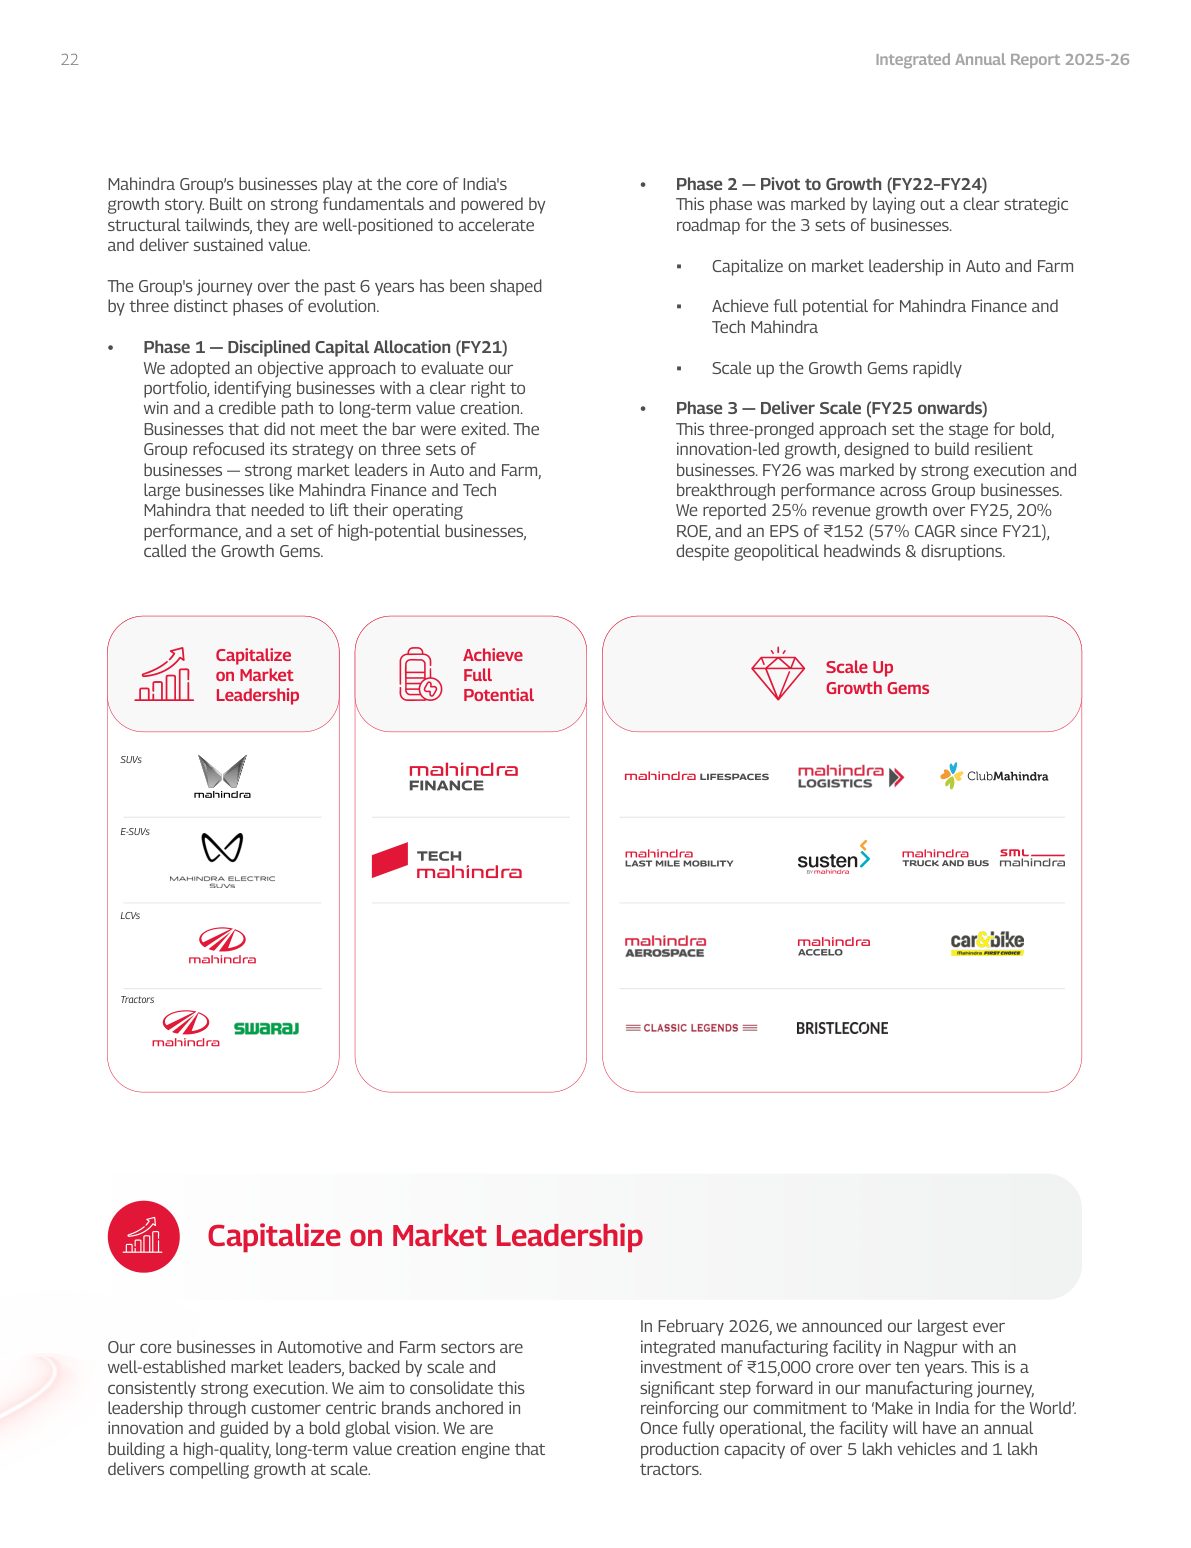
Each business then gets growth vectors, highlights and a stated ambition. Tech Mahindra targets an EBIT margin of 15%, ROCE above 30% and over 85% of free cash flow returned to shareholders by the end of FY27; Mahindra Finance aspires to grow its AUM fivefold this decade; Mahindra Lifespaces wants ₹10,000 crore of sales by FY30; Susten plans to grow from 2.1 GWp to 7.0 GWp by FY31. The Farm pages name the three international exits in plain terms: the sale of Sampo Rosenlew in Finland, the liquidation of MAM Japan and the announced sale of Erkunt Foundry in Turkey, all "targeted at markets with structural weaknesses and an unclear path to profitability". The Auto pages give the E-SUV business's first full-year margins, an EBITDA margin of 9.1% and an EBIT margin of 2.0%, which is the kind of number most companies would leave out.
The risk chapter (pp. 35 to 37) is short and useful. It names the IMD's forecast of a below-normal monsoon for FY27 at 90-92% of the long-period average, explains why the farm business thinks it can absorb that, and says capital allocation decisions go through a Board sub-committee, the Committee for Strategic Investments.
The point dropped is at the front. The Chairman's letter is a well-written essay on the "Samudra Manthan", India as a "connector economy" and Formula E, with the line that "the pond is full of black swans", but the only company numbers in it are patents and the Nagpur investment. The Group CEO and MD's letter carries the results. And before the reader reaches any of the strategy, there are four pages of awards and accolades (pp. 17 to 20), led by the TIME World's Best Companies ranking.
Integrated thinking and the capitals: 3/5
The Group Value Creation Model (pp. 39 to 40) is a proper model: inputs for each of the six capitals on the left, the Rise philosophy and support functions in the middle, outputs by business, and outcomes for each capital on the right. The inputs are numeric: net capital expenditure of ₹9,112 crore, 61 manufacturing facilities, material cost of ₹1,22,922 crore, 210.4k permanent employees, 35% renewable electricity, ₹392 crore of Group CSR.
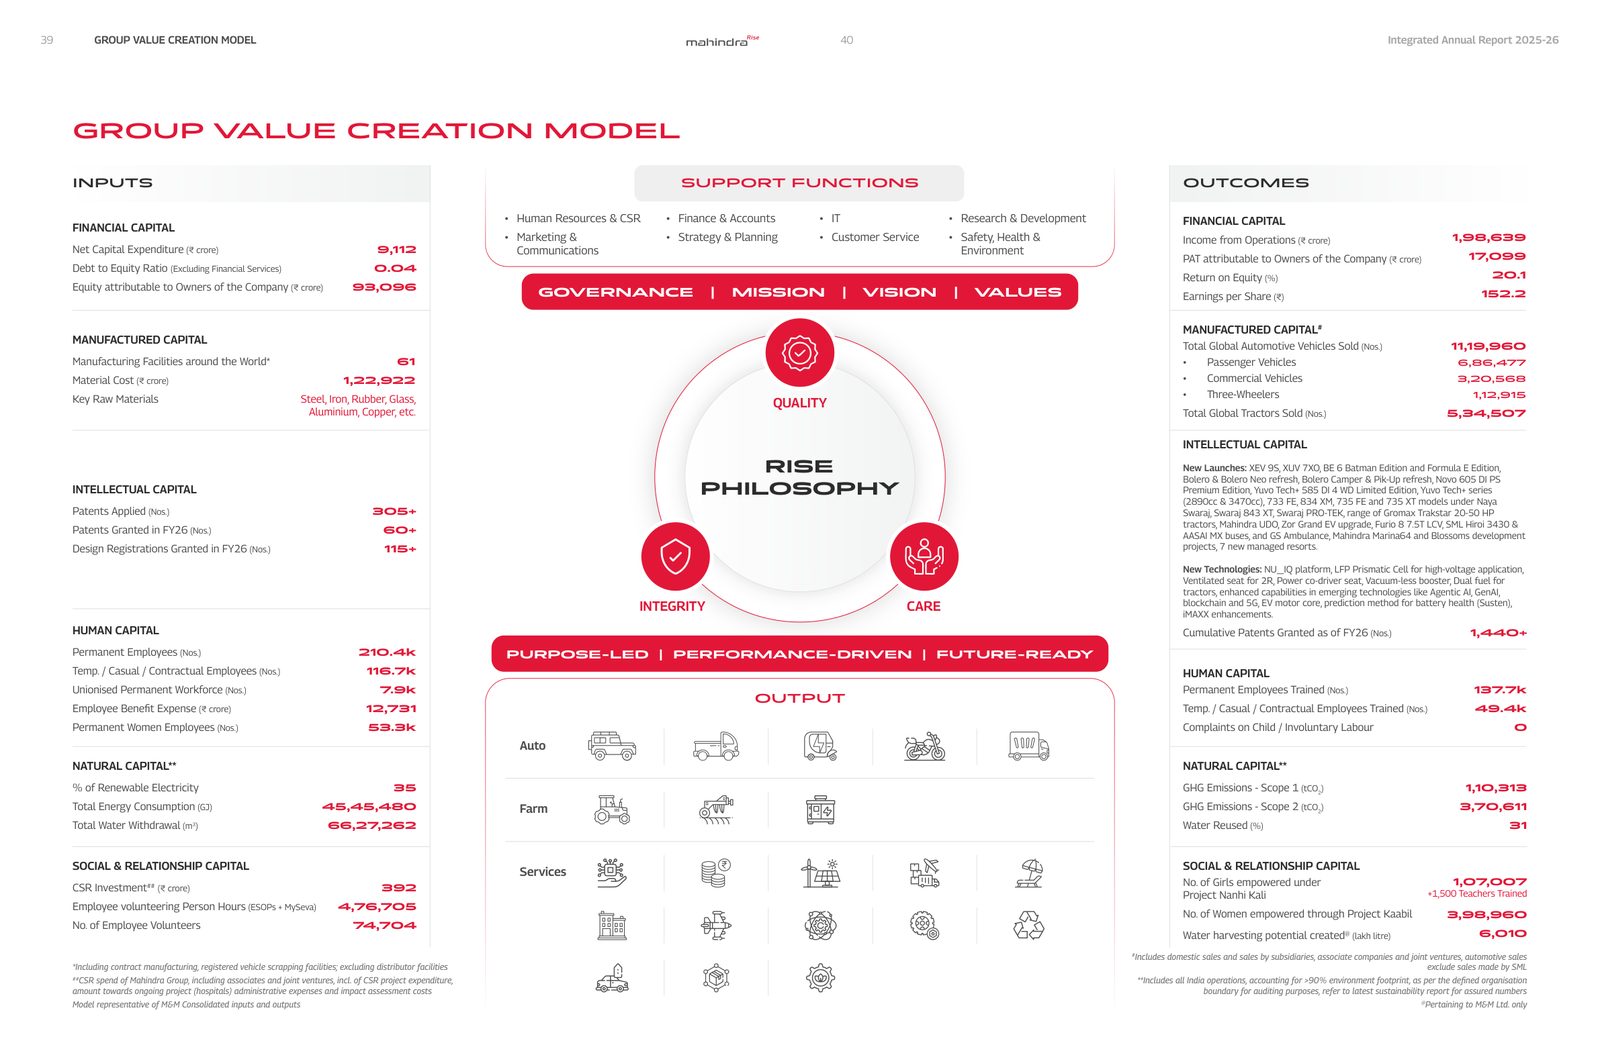
The outcomes are where it thins. Most are outputs: 11,19,960 vehicles and 5,34,507 tractors sold, a paragraph listing every launch, 137.7k employees trained, Scope 1 and 2 emissions in tonnes. There is no prior-year figure anywhere on the spread, so the reader cannot tell whether any outcome improved, and the natural capital footnote tells readers to "refer to latest sustainability report for assured numbers". Nor do the capitals reappear: the chapters that follow are organised by the Rise pillars, and no chapter says which capital or material topic it addresses. Compare TCS or L&T, where the capitals run through the report; here they live on one spread. In the PDF, which is built as single pages, the model is also split down the middle across two pages.
BRSR and ESG integration: 3/5
The BRSR is inside the report and well assured. DNV Business Assurance India Private Limited gives reasonable assurance on BRSR Core under its VeriSustain protocol and ISAE 3000, with the boundary stated precisely: all Indian locations for attributes 5 to 9, and 27 manufacturing plants, the corporate office and 13 area offices for attributes 1 to 4 (p. 295). The BRSR reports Scope 3 in full, 12,37,05,567 tCO2e against 9,45,16,227 the year before, with a footnote attributing the rise to including the Trucks and Buses business (p. 286). It also reports zero fatalities among employees and workers (p. 269).
The ESG chapter in the integrated section sets out nine commitments with dates: 100% renewable electricity by 2030, all sites certified zero waste to landfill by 2030, EP100 by 2030, and carbon neutrality for Scope 1 and 2 by 2040 with science-based targets (p. 69).
The materiality page (p. 72) is the weak point. It explains that the Group has moved to a double materiality approach, "aligned with GRI Standards", and that material topics feed strategy, risk and target-setting. It does not name a single topic. The reader is sent to the Sustainability Report on the company's website. The BRSR's own table of material issues has eight rows (product stewardship, resource circularity, water, carbon emissions as risk and as opportunity, CSR, health and safety, sustainable supply chain), so the list exists; it just isn't in the integrated report.
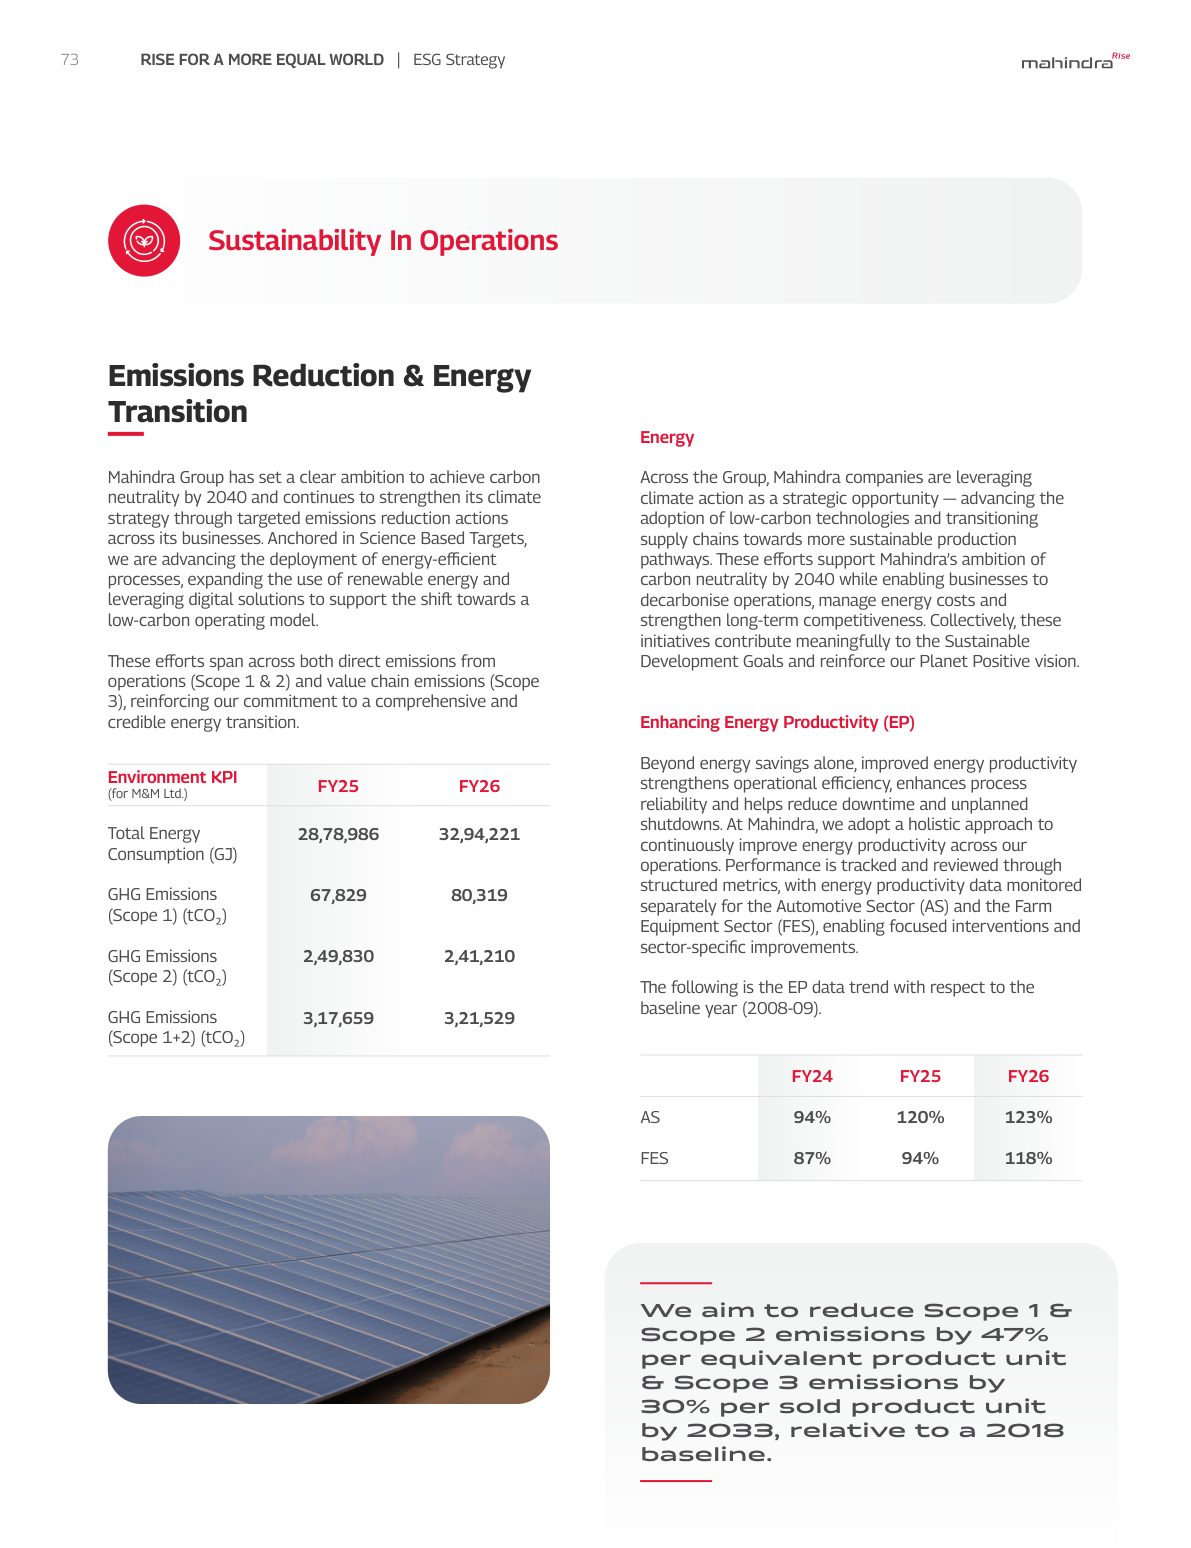
The emissions page (p. 73) has the opposite problem. It prints M&M's total energy use (up from 28,78,986 GJ to 32,94,221 GJ) and Scope 1 and 2 emissions (up from 3,17,659 to 3,21,529 tCO2), and beside it the target: a 47% cut in Scope 1 and 2 per equivalent product unit by 2033 from 2018. It gives no intensity figure, so a reader sees absolute emissions rising and a relative target, with nothing connecting them. The connection is in the BRSR (p. 256), which says emissions are down 57% in the Auto sector and 39% in Farm from FY2018-19, that 19 of 23 sites are zero waste to landfill certified, and that renewable energy is about 37%. With vehicle volumes up 18.8% and tractors up 24% while Scope 1 and 2 rose about 1%, this is a good story. The integrated report doesn't tell it.
Governance disclosure: 3/5
The statutory governance disclosure is complete. The corporate governance report gives a profile of each director with DIN, category, expertise, directorships and shareholding, identifies the Board's core skills, and the Board's report covers evaluation and the ratio of each director's pay to the median employee (median remuneration ₹12.46 lakh, up 8.16%). The Chairman is identified as promoter, and a Lead Independent Director, Shikha Sharma, chairs the Risk Management and the Governance, Nomination and Remuneration committees.
What the integrated section lacks is any governance narrative of its own beyond a page of Board photographs and the risk chapter's paragraph on committees. There is no statement from the Board taking responsibility for the integrated report. ESG governance is described with the Group Executive Board, chaired by the Group CEO and MD, "at the apex" (p. 71), which is management, with Board-level oversight mentioned in a bullet. And materiality outcomes are not said to be approved by any Board committee. Hindustan Zinc and Bharti Airtel show what this looks like when it is done.
Financial storytelling: 3/5
The results are stated without spin. The performance highlights page (p. 7) leads with consolidated income from operations of ₹1,98,639 crore (up 25%) and PAT of ₹17,099 crore (up 32%), then the standalone figures. The Board's report (p. 100) gives the dividend of ₹33 a share, absorbing ₹4,103.65 crore and a payout of 26.2% of standalone profit, against ₹25.3 and 26.5% a year earlier. The exceptional item is small and explained: ₹98.19 crore of retiral costs from the new Labour Codes at standalone level. The MD&A (p. 185) gives eight standalone ratios with both years and explains the two that moved more than 25%.
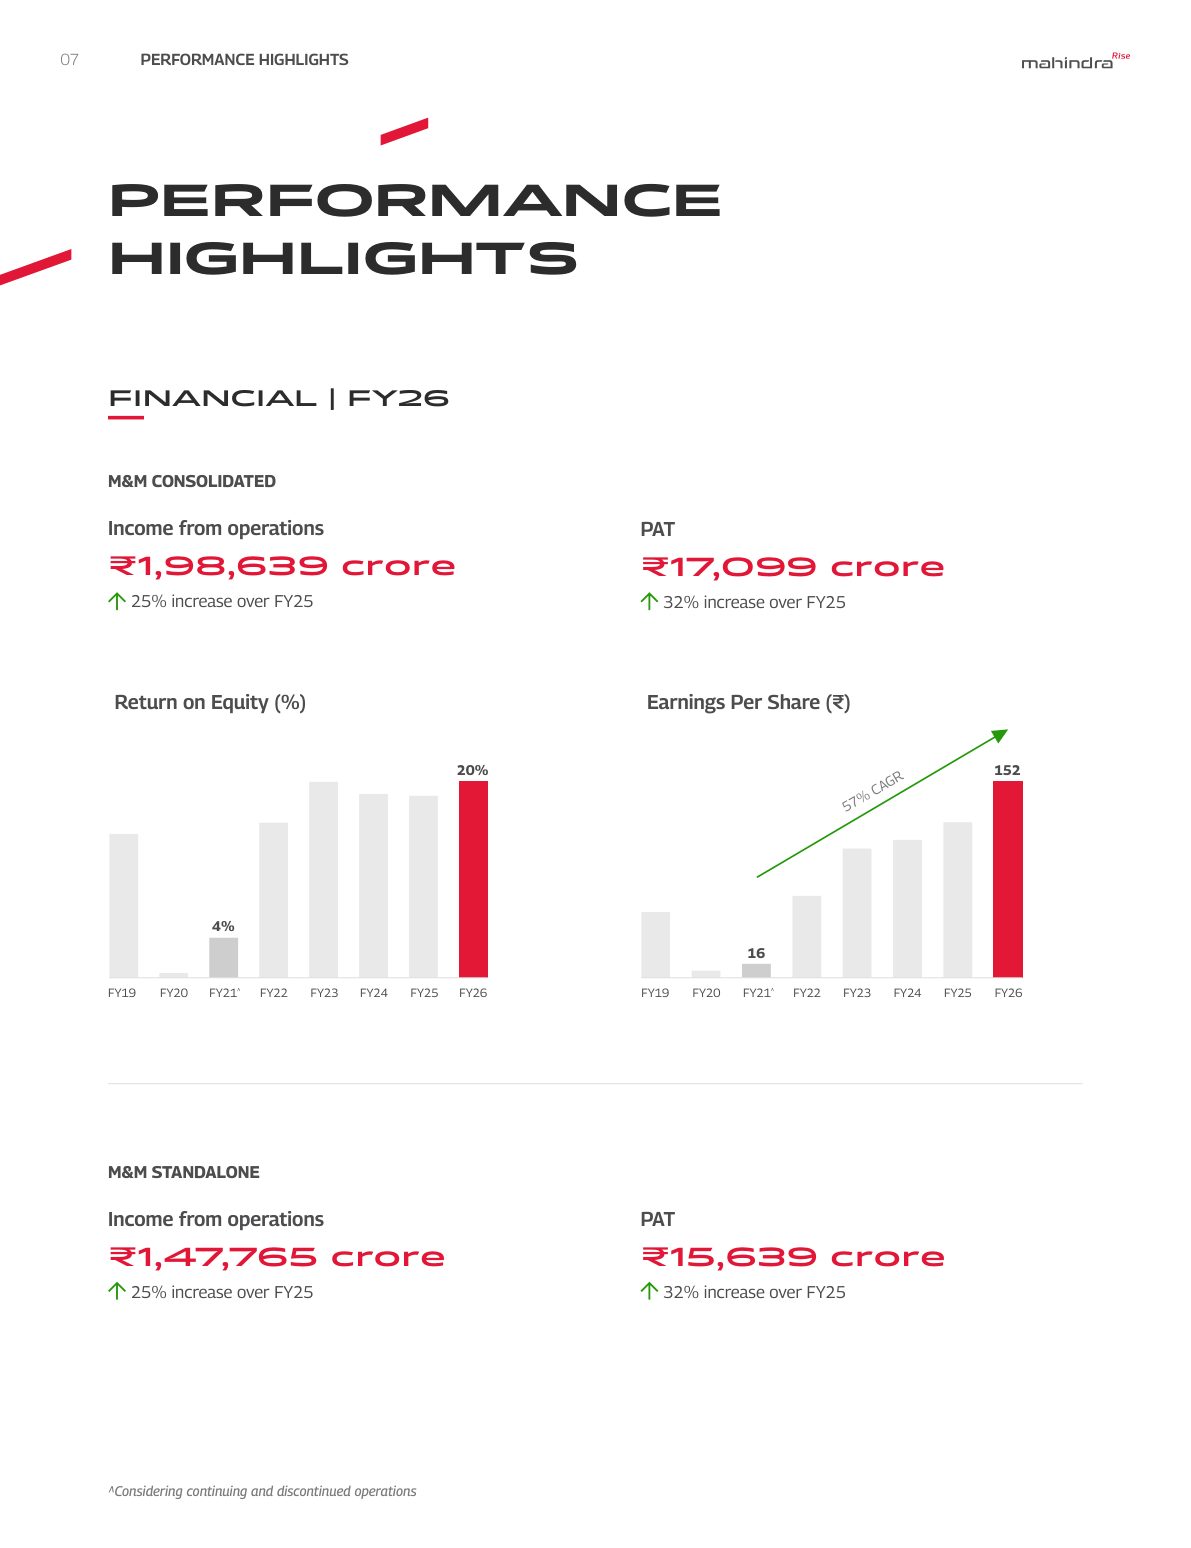
The highlights page is thin for a record year. It has two numbers for the group, two for the company, and two bar charts, ROE and EPS from FY19 to FY26, where only the FY21 and FY26 bars carry values. There is no multi-year financial table anywhere in the report, no margin on the highlights page (the standalone operating margin in fact slipped from 15.5% to 15.2%), and no cash flow. The market share tiles use revenue share for SUVs (25.3%), while the Board's report gives a volume UV share of 21.3%; both are legitimate, but the choice should be flagged where it's made.
Design and readability: 4/5
The integrated section is compact at 93 pages, uses one visual system throughout (red headings, grey panels, the same FY26 Achievements tiles for every business) and is easy to read. Business pages follow one pattern: what the business is, its ambition, growth vectors, highlights and achievements. The case studies in the ESG chapter each end with results in numbers.
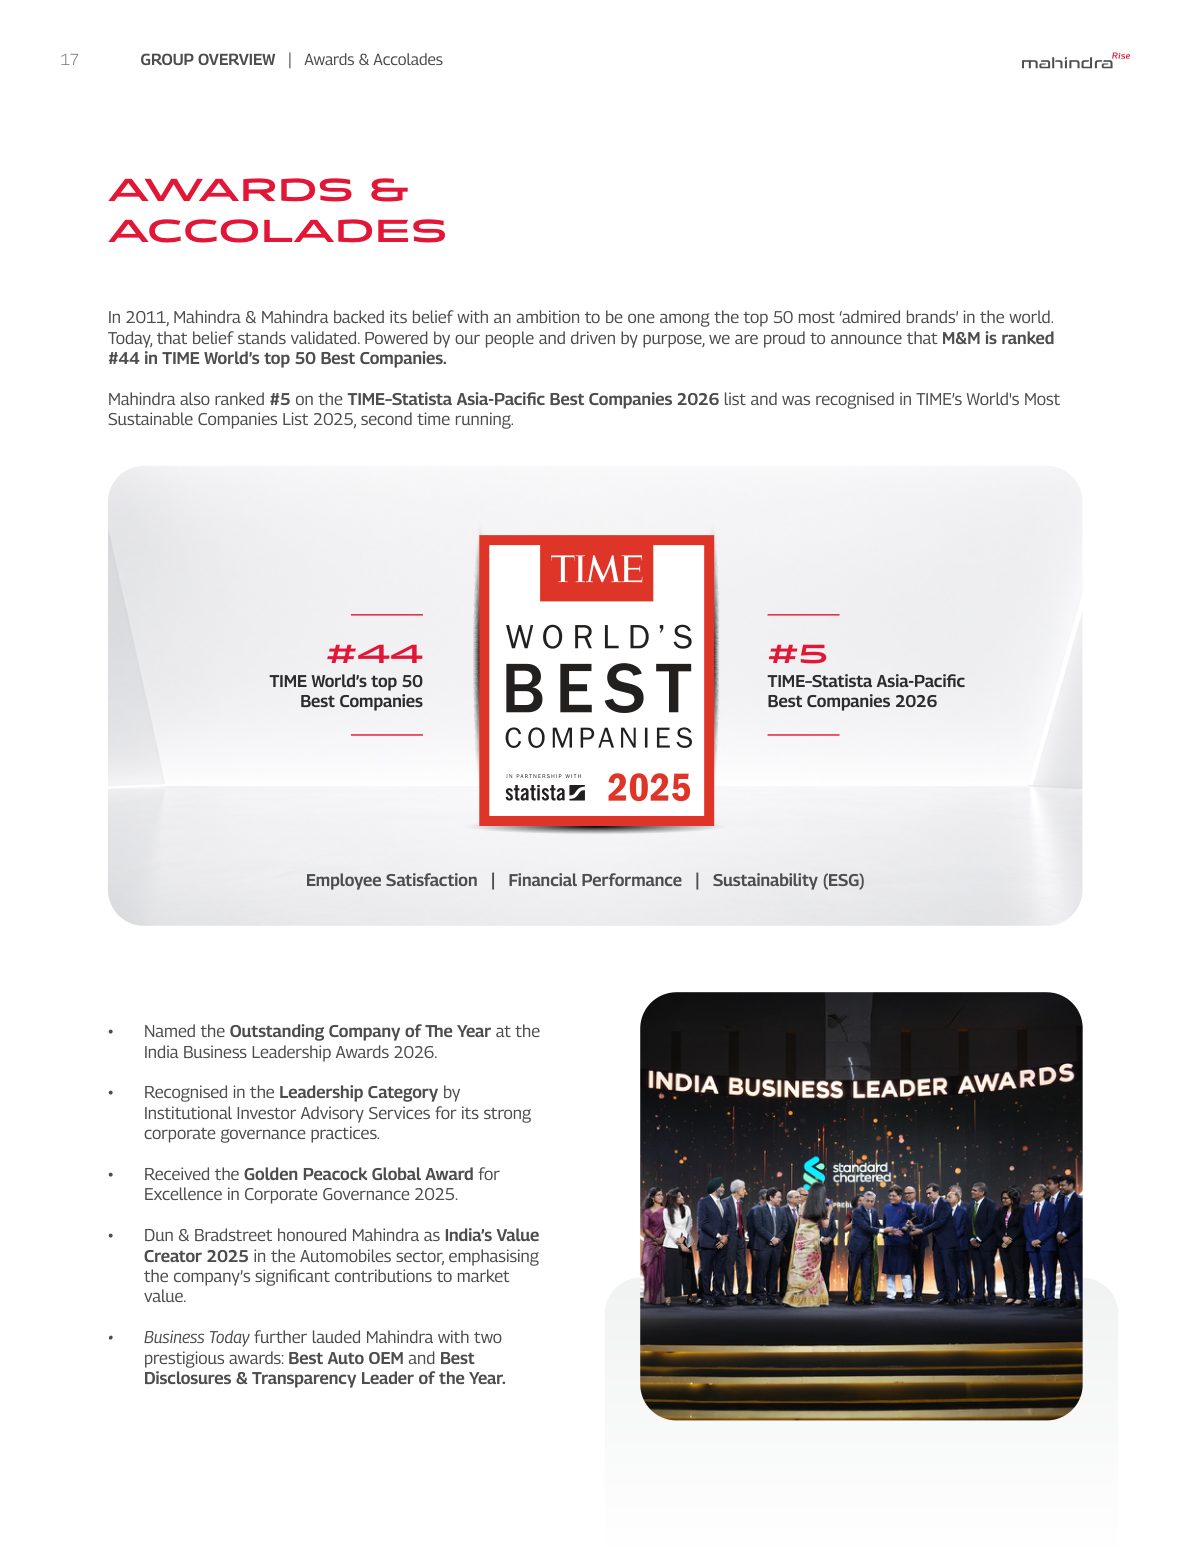
The point dropped is sequencing. Four pages of awards sit between the Group Executive Board and the strategy, and the ESG chapter repeats the sustainability ratings and TIME listing again on page 78.
Digital version: 4/5
The PDF is well built for screen reading: single pages rather than spreads, a text layer throughout, 31 bookmarks in two levels, and a contents page whose entries are hyperlinked. There is no return-to-contents link on each page, as ITC's report has. The company also publishes an online edition at mahindra.com/annual-report-FY2026, a FlippingBook page-turner with the full report, which we confirmed exists. The PDF never mentions it: the only QR code is on the back cover, marked "Scan QR code to download", and the Board's report points to a separate web page for the financial statements. As with ICICI Bank, the digital edition exists but a PDF reader wouldn't know it.
What reporting teams can take from it
Copy the strategy chapter. Telling the portfolio story as phases, grouping businesses by what the company wants from them, naming the exits and giving each business a dated ambition is exactly what an investor wants from a conglomerate report. Copy the decision to print E-SUV margins in their first full year, and the risk chapter's honesty about the monsoon.
Then put the material topics on the materiality page, bring the BRSR's progress against the 2018 baseline into the emissions page so the absolute numbers have their context, add prior-year figures to the value creation model's outcomes, give the highlights page a proper multi-year table, move the awards to the back, and print the online edition's address in the PDF.
Series scorecard
Every report in this series is scored on the same seven-point card by the same reader. Scores are editorial opinion of the published document; each review carries the page references behind its findings.
| Company | Score (of 35) |
|---|---|
| Hindustan Zinc | 30 |
| TCS | 29 |
| HUL | 28 |
| Bharti Airtel | 27 |
| L&T | 27 |
| Reliance | 27 |
| HDFC Bank | 26 |
| Asian Paints | 25 |
| ICICI Bank | 25 |
| Infosys | 25 |
| LTM | 25 |
| Tata Steel | 25 |
| M&M (this review) | 24 |
| Titan | 23 |
| ITC | 21 |
| Sun Pharma | 21 |
| Bajaj Finance | 20 |
| NTPC | 20 |
Frequently asked questions
How is Mahindra's Integrated Annual Report 2025-26 structured?
Leadership messages from the Chairman and the Group CEO and MD, performance highlights, a Group overview (the Group, Board, Group Executive Board and awards), Rise to Create Value (strategic overview, risk management, opportunities and outlook), the Group Value Creation Model, Rise to be Future-Ready (manufacturing, digital and AI, new products), Rise for a More Equal World (ESG strategy, people and culture, social impact), corporate information, statutory reports including the BRSR, and standalone and consolidated accounts. It runs to 487 printed pages, plus a separately numbered AGM notice.
What is Mahindra's strategy as described in the report?
The report describes three phases: disciplined capital allocation in FY21, when businesses without a clear right to win were exited; a pivot to growth from FY22 to FY24; and delivering scale from FY25. The businesses are grouped as market leaders to capitalise on (SUVs, E-SUVs, LCVs and tractors), Mahindra Finance and Tech Mahindra to bring to full potential, and twelve Growth Gems to scale up, each with a stated ambition.
Who assures Mahindra's BRSR?
DNV Business Assurance India Private Limited provides reasonable assurance on the BRSR Core indicators, under its VeriSustain protocol and ISAE 3000. The statutory auditor for the financial statements is B S R & Co. LLP.
What are Mahindra's climate targets and emissions?
The report states an ambition of carbon neutrality (Scope 1 and 2) by 2040 and a science-based target to cut Scope 1 and 2 emissions by 47% per equivalent product unit and Scope 3 by 30% per sold product unit by 2033 from a 2018 baseline. For M&M Ltd, Scope 1 and 2 emissions were 3,21,529 tCO2 in FY26 against 3,17,659 in FY25, and the BRSR reports Scope 3 of 12,37,05,567 tCO2e. Renewable electricity was 37% of M&M's electricity, against a 100% target for 2030.
What were Mahindra's FY26 results?
Consolidated income from operations of ₹1,98,639 crore, up 25%; PAT attributable to owners of ₹17,099 crore, up 32%; ROE of 20.1%; and EPS of ₹152.2. Standalone income from operations was ₹1,47,765 crore and PAT ₹15,639 crore. The Board recommended a dividend of ₹33 per share, absorbing ₹4,103.65 crore.
How does The Footnotes score annual reports?
Seven criteria, each scored 1 to 5 with a one-line reason: strategy and narrative; integrated thinking and capitals; BRSR and ESG integration; governance disclosure; financial storytelling; design and readability; and the digital version. Scores are editorial opinion based on the published document, and the same card is used for every company so results can be compared.
Sources
- Mahindra & Mahindra: Integrated Annual Report 2025-26 (online edition) — Mahindra & Mahindra Limited
- Mahindra & Mahindra: Investor relations: reports — Mahindra & Mahindra Limited
- Mahindra & Mahindra: Sustainability reports — Mahindra & Mahindra Limited
- SEBI circular: BRSR Core, framework for assurance and ESG disclosures for value chain (12 July 2023) — SEBI