

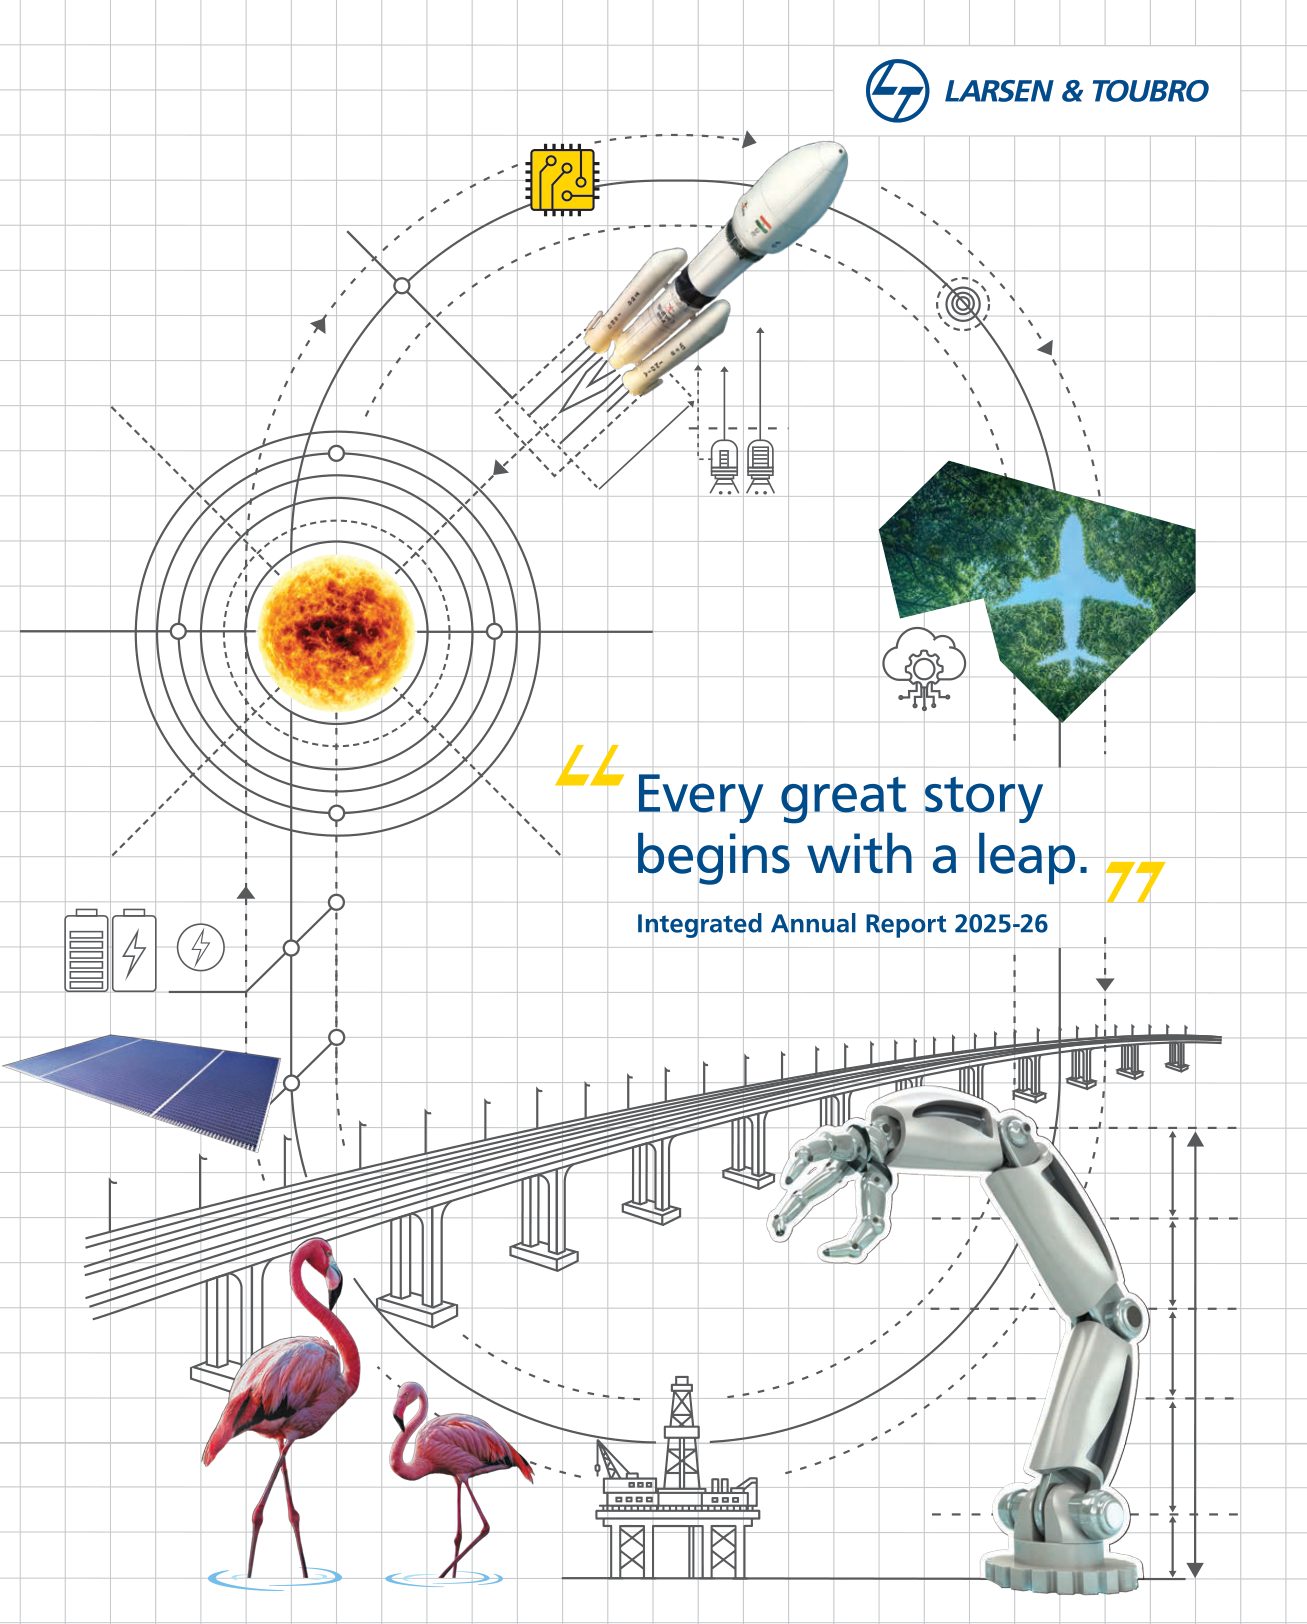
L&T Integrated Annual Report 2025-26: A Review
Larsen & Toubro's 754-page report contains a first double materiality assessment done by a third party, a value creation model that quantifies inputs and outputs down to tonnes of cement and kilometres of tunnel, and a standalone results table that shows recurring profit, the exceptional item and statutory profit on three adjacent lines. It also contains a 146-page MD&A before the integrated report begins, and a Chairman's message that never mentions the ₹6,843 crore exceptional charge.
 In short
Key takeaways
- The PDF runs to 754 pages: corporate overview and Chairman's message, ten-year highlights, a 146-page MD&A (pages 26 to 171), a 175-page Integrated Report (172 to 346), the BRSR (347 to 402), AGM notice, Board's report with five annexures, standalone and consolidated statements, subsidiary information and a stakeholder satisfaction survey form.
- The value creation model gives numeric inputs and outputs for all six capitals: 12.7 million kl of water and 10.2 million GJ of energy in; 3.2 million tonnes of cement, 5.1 million tonnes of sand and 1.8 million tonnes of ferrous material consumed; 67.1 million sq ft of buildings, 122 km of bridges and tunnels, 8,006 MWp of solar and 1,173 million litres a day of water treatment capacity out; 0.9 million tCO2e of Scope 1 and 2 emissions; return on net worth 8.59%.
- FY 2025-26 was L&T's first double materiality assessment, conducted by an independent third party against ESRS and GRI 2021, with impact materiality scored on scale, scope and irremediability; material topics are presented with their impacts, risks and opportunities and linkages, and the company commits to a full reassessment every three years with annual reviews.
- The standalone results table in the MD&A shows Recurring PAT of ₹13,130 crore (up 26%), an Exceptional Item of ₹(6,843) crore (gratuity revision under the Labour Codes and impairment of the investment in L&T Metro Rail Hyderabad ahead of its sale), and Overall PAT of ₹6,287 crore (down 42%), with RONW falling to 8.6% and EPS to ₹45.71; the ten-year table carries both PAT lines.
- The 2,500-word Chairman and Managing Director's message discusses record order inflows, the ₹7.40 lakh crore order book and the West Asia conflict, but does not mention the exceptional charge, the Hyderabad Metro impairment or the fall in statutory profit; the corporate overview leads with Group 'Recurring PAT' of ₹17,238 crore, up 18%.
- BDO India Services provides reasonable assurance on BRSR Core under ISAE 3000; Scope 1 emissions are 6,17,113 tCO2e, Scope 2 (market-based) 2,89,920 tCO2e, and Scope 3 is disclosed across nine of fifteen categories with purchased goods at 6.38 million tCO2e; targets are carbon neutrality by 2040 and water neutrality by 2035.
Larsen & Toubro builds things that can be counted, and its annual report counts them: 67.1 million square feet of buildings, 122 kilometres of bridges and tunnels, 6,900 circuit-kilometres of transmission line, 8,006 MWp of solar capacity, 1,173 million litres a day of water treatment. That instinct produces the most quantified value creation model in this series and a financial table that shows the year's exceptional charge in plain sight. It also produces a 754-page document.
As with every review in this series, we read the published PDF against the <IR> Framework, SEBI's BRSR Core expectations and plain readability, and score it on the same seven-point card. Scores are our opinion. Screenshots are small excerpts reproduced for review and remain the copyright of Larsen & Toubro Limited; the full report is on the company's investor pages.
The scorecard
| Criterion | Score (of 5) | In one line |
|---|---|---|
| Strategy and narrative | 3 | Strategic objectives and enablers are set out; the Chairman's message is long, macro-heavy, and silent on the exceptional charge |
| Integrated thinking and the capitals | 5 | Inputs and outputs quantified for every capital on one spread; capital chapters carry material topics and SDGs |
| BRSR and ESG integration | 5 | First double materiality assessment, third-party and dated; IFRS S1/S2 and TCFD framing; Scope 3 in nine categories; reasonable assurance from BDO |
| Governance disclosure | 4 | Sustainability governance is drawn out and the Board's report is complete; combined Chairman-MD role is stated |
| Financial storytelling | 4 | Recurring, exceptional and overall PAT on adjacent lines, both in the MD&A and the ten-year table; the overview leads with 'recurring' |
| Design and readability | 2 | A 146-page MD&A before the integrated report; the reader needs the bookmarks to survive |
| Digital version | 4 | Full bookmark tree, single pages, section tabs on every page |
| Total | 27 / 35 |
What the report is
The contents page (which is page 14, after twelve pages of cover, credo and Chairman's message) sets out five sections: Corporate Overview, Management Discussion and Analysis, Integrated Report, Statutory Reports and Financial Statements. The MD&A runs from page 26 to page 171 and covers each business in turn. The Integrated Report runs from 172 to 346: an approach page, value creation process and model, stakeholder engagement, materiality, sustainability governance, highlights, and six capital chapters. The BRSR follows at 347 to 402, then the AGM notice, the Board's report and its annexures, the financial statements, subsidiary information, a stakeholder satisfaction survey form and awards.
The approach page (173) is short but adequate: narrative sections follow "the IIRC's <IR> Framework" (the same dated attribution Infosys uses), the BRSR follows NGRBC as mandated by SEBI, the period is stated, and BDO India Services provides reasonable assurance on BRSR Core. There is no statement of who approved the integrated report.
Key number: 172 — the page on which the Integrated Report begins.
Strategy and narrative: 3/5
The strategic framework is set out in the value creation process: strategic objectives (SO-I to SO-V, the fifth being "enabling business sustainability through a high focus on ESG") and strategic enablers, with material topics, stakeholder engagement and governance feeding in. The MD&A then reports each business against them at length, and the corporate overview's "year at a glance" lists the year's deals and partnerships: the TenneT North Sea HVDC consortium with Hitachi Energy, the AMCA consortium with BEL, General Atomics for remotely piloted aircraft, ITOCHU for green ammonia at Kandla, a proposed sovereign AI factory under the IndiaAI Mission, and the agreed divestments of Nabha Power (₹6,889 crore enterprise value, to Torrent) and Hyderabad Metro.
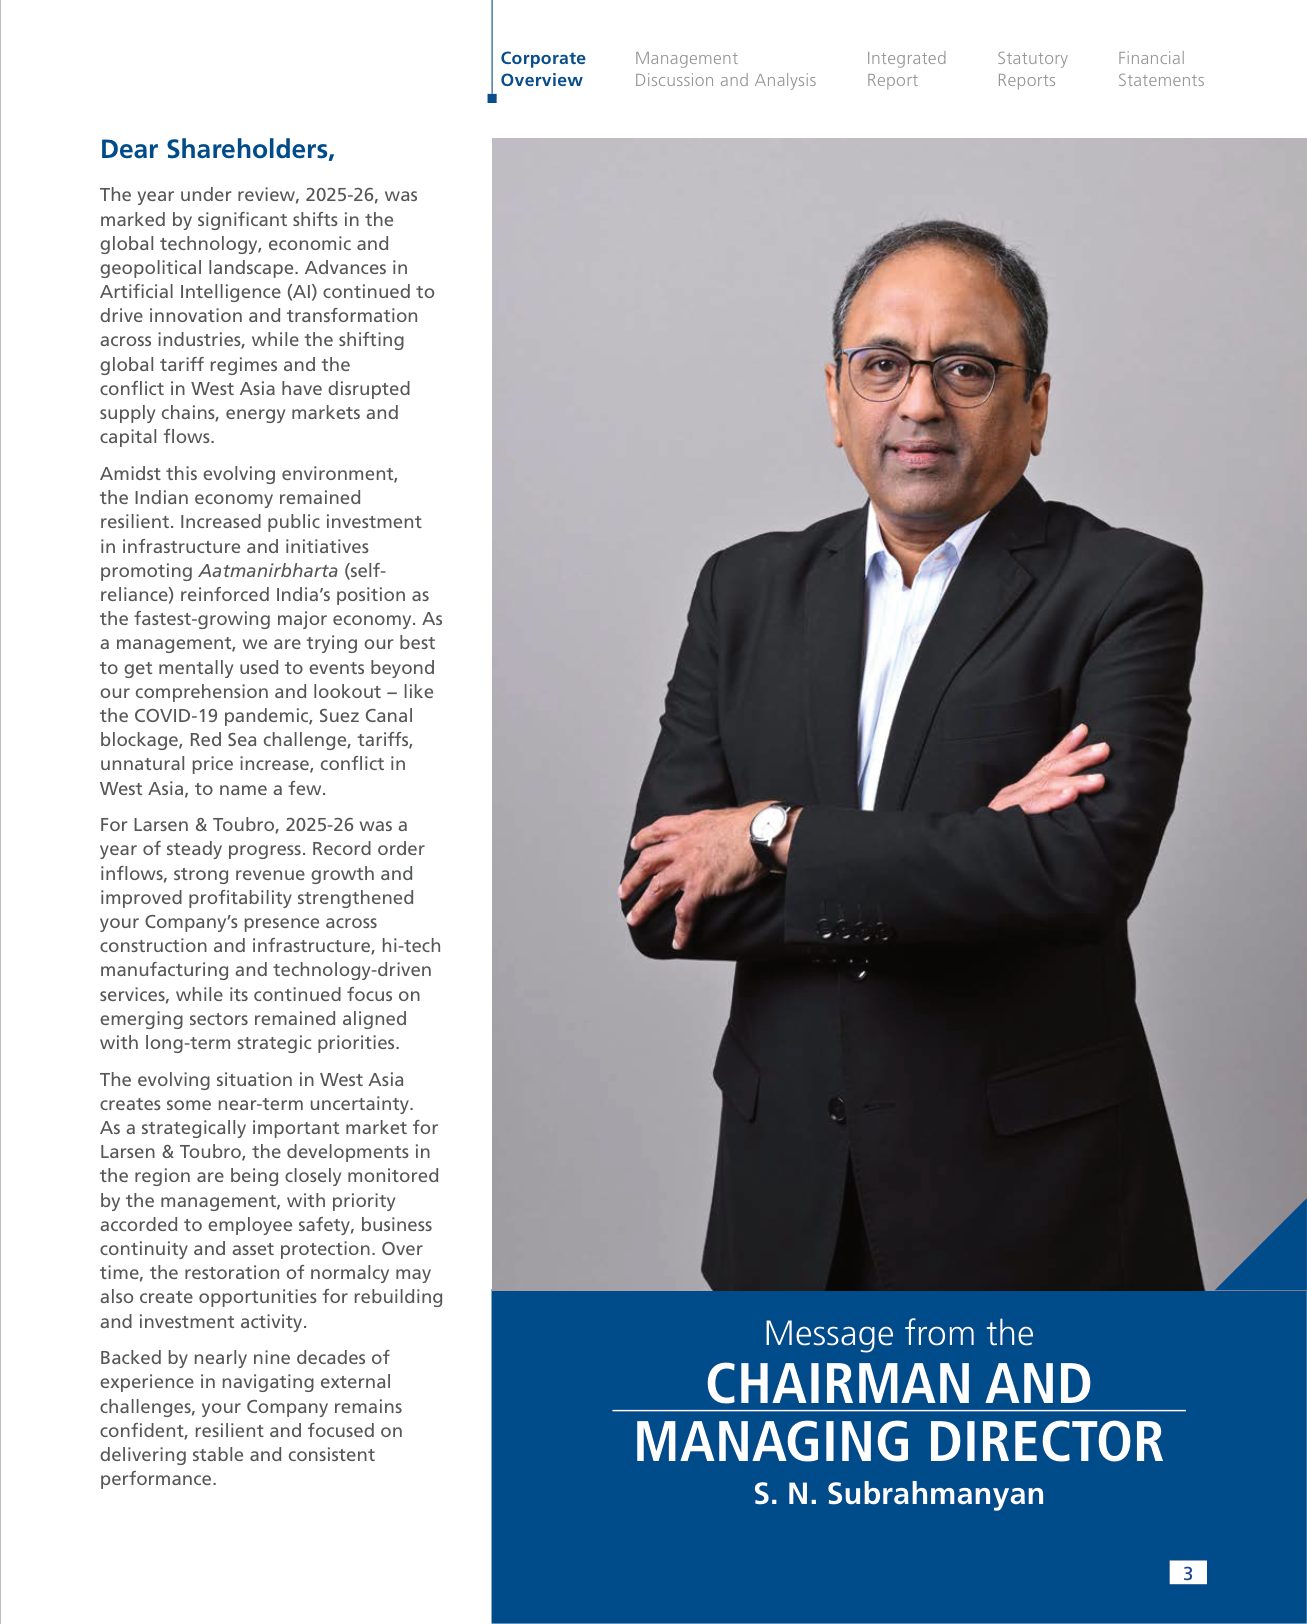
The Chairman and Managing Director's message runs to about 2,500 words. It is candid about the environment ("we are trying our best to get mentally used to events beyond our comprehension") and clear on the operating story: record order inflows, an order book of ₹7.40 lakh crore up 28%, international orders at 52% and exceeding domestic wins for a third year, and Group recurring PAT of ₹17,238 crore, up 18%. It does not mention the exceptional item, the impairment of the Hyderabad Metro investment ahead of its sale, or that standalone statutory profit fell 42% and return on net worth halved. Those facts are in the MD&A on page 47 and in the ten-year table. A shareholder letter that omits the year's largest single charge is not telling the whole story, however good the rest of it is.
Integrated thinking and the capitals: 5/5
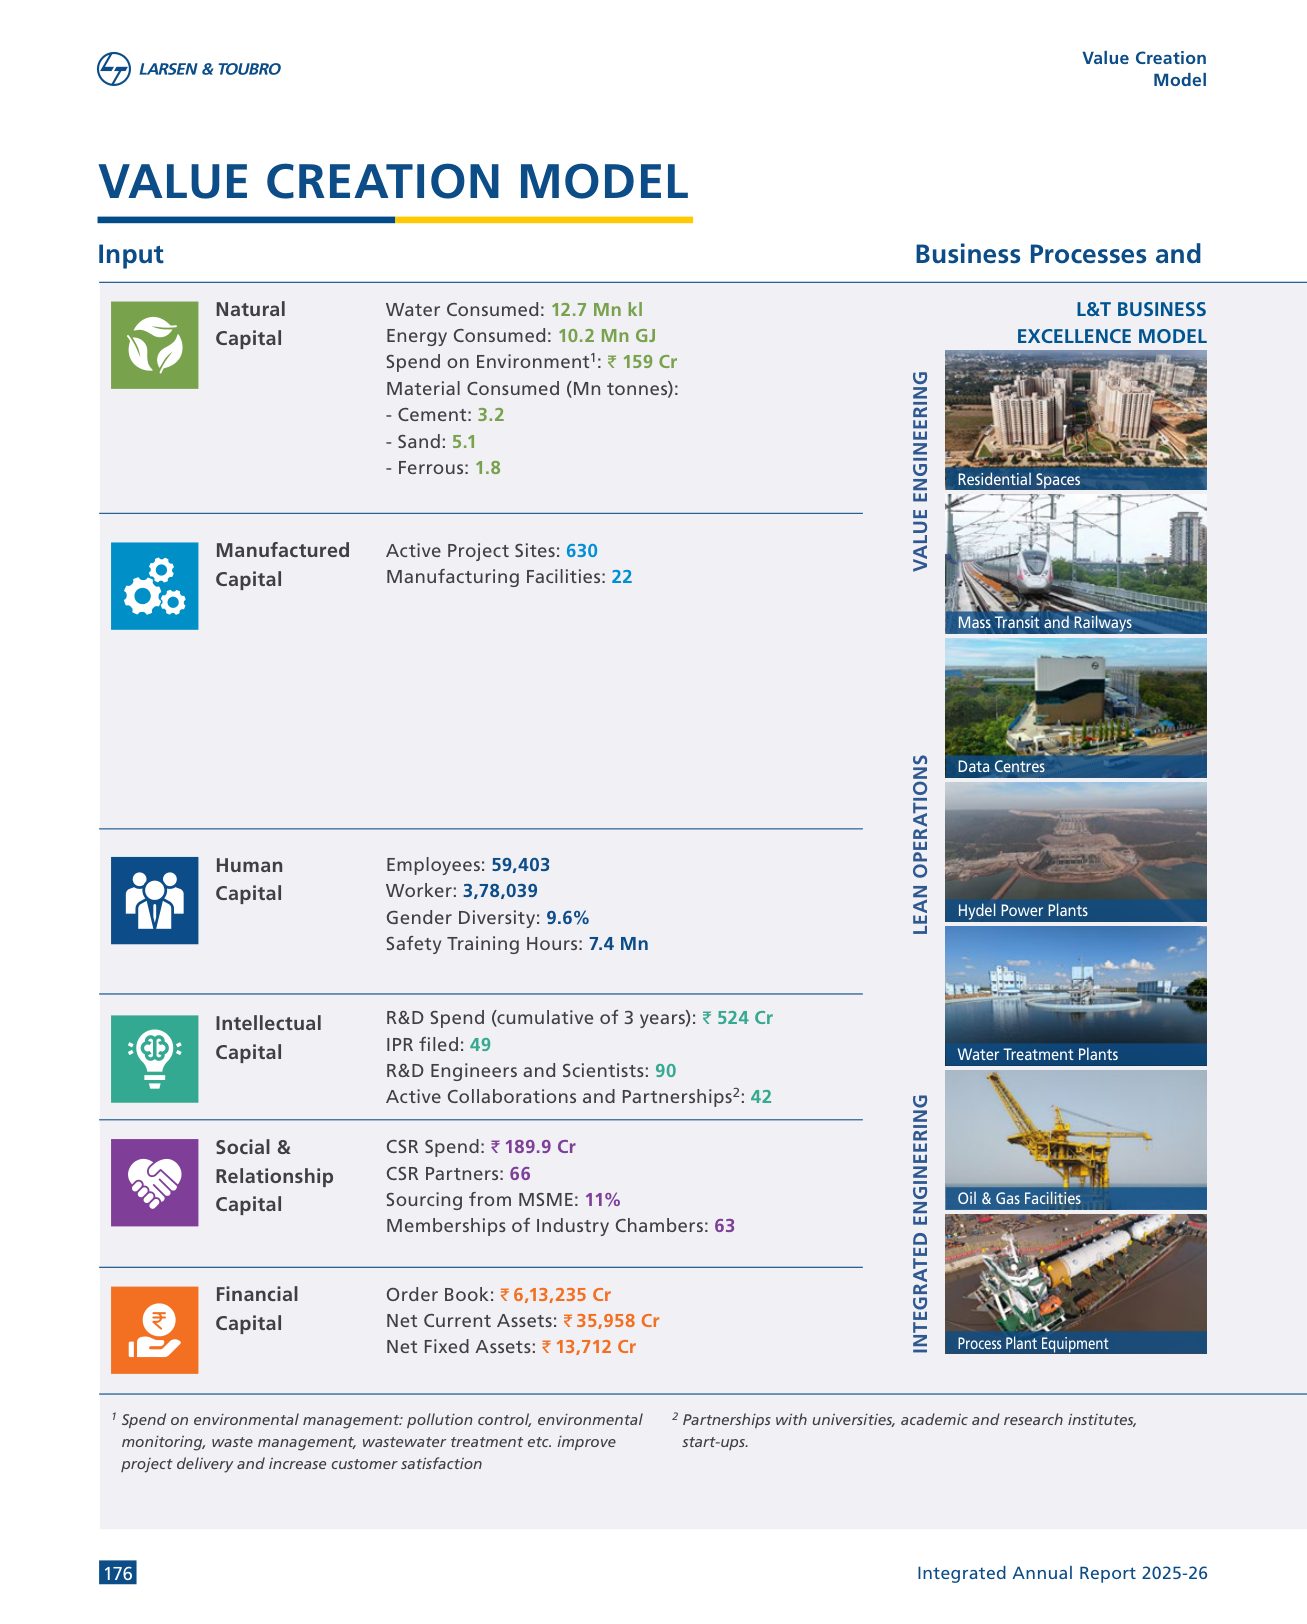
The value creation model is two facing pages. The left page lists inputs by capital with figures: 12.7 million kilolitres of water, 10.2 million GJ of energy, ₹159 crore of environmental spend, and 3.2 million tonnes of cement, 5.1 million of sand and 1.8 million of ferrous material under natural capital; 630 active project sites and 22 manufacturing facilities; 59,403 employees and 3,78,039 workers, 9.6% gender diversity and 7.4 million safety training hours; ₹189.9 crore of CSR; an order book of ₹6,13,235 crore; ₹524 crore of cumulative R&D spend and 49 IPR filings.
The right page lists outputs and offerings by capital: 0.9 million tCO2e of GHG emissions at 5.9 tCO2e per crore of revenue and 4 million kilolitres of water offset; turnover of ₹1,53,680 crore, PBIT of ₹17,938 crore, ₹5,227 crore of dividends and a return on net worth of 8.59%; 1.9 million CSR beneficiaries and ₹7,742 crore to the exchequer; roughly ₹78,700 crore of green business revenue; the infrastructure created (buildings, mobility, power, water and sanitation, factory output of 3,00,493 tonnes); nine patents granted and 207 value engineering projects; 130 women in senior management and 1,369 million accident-free working hours.
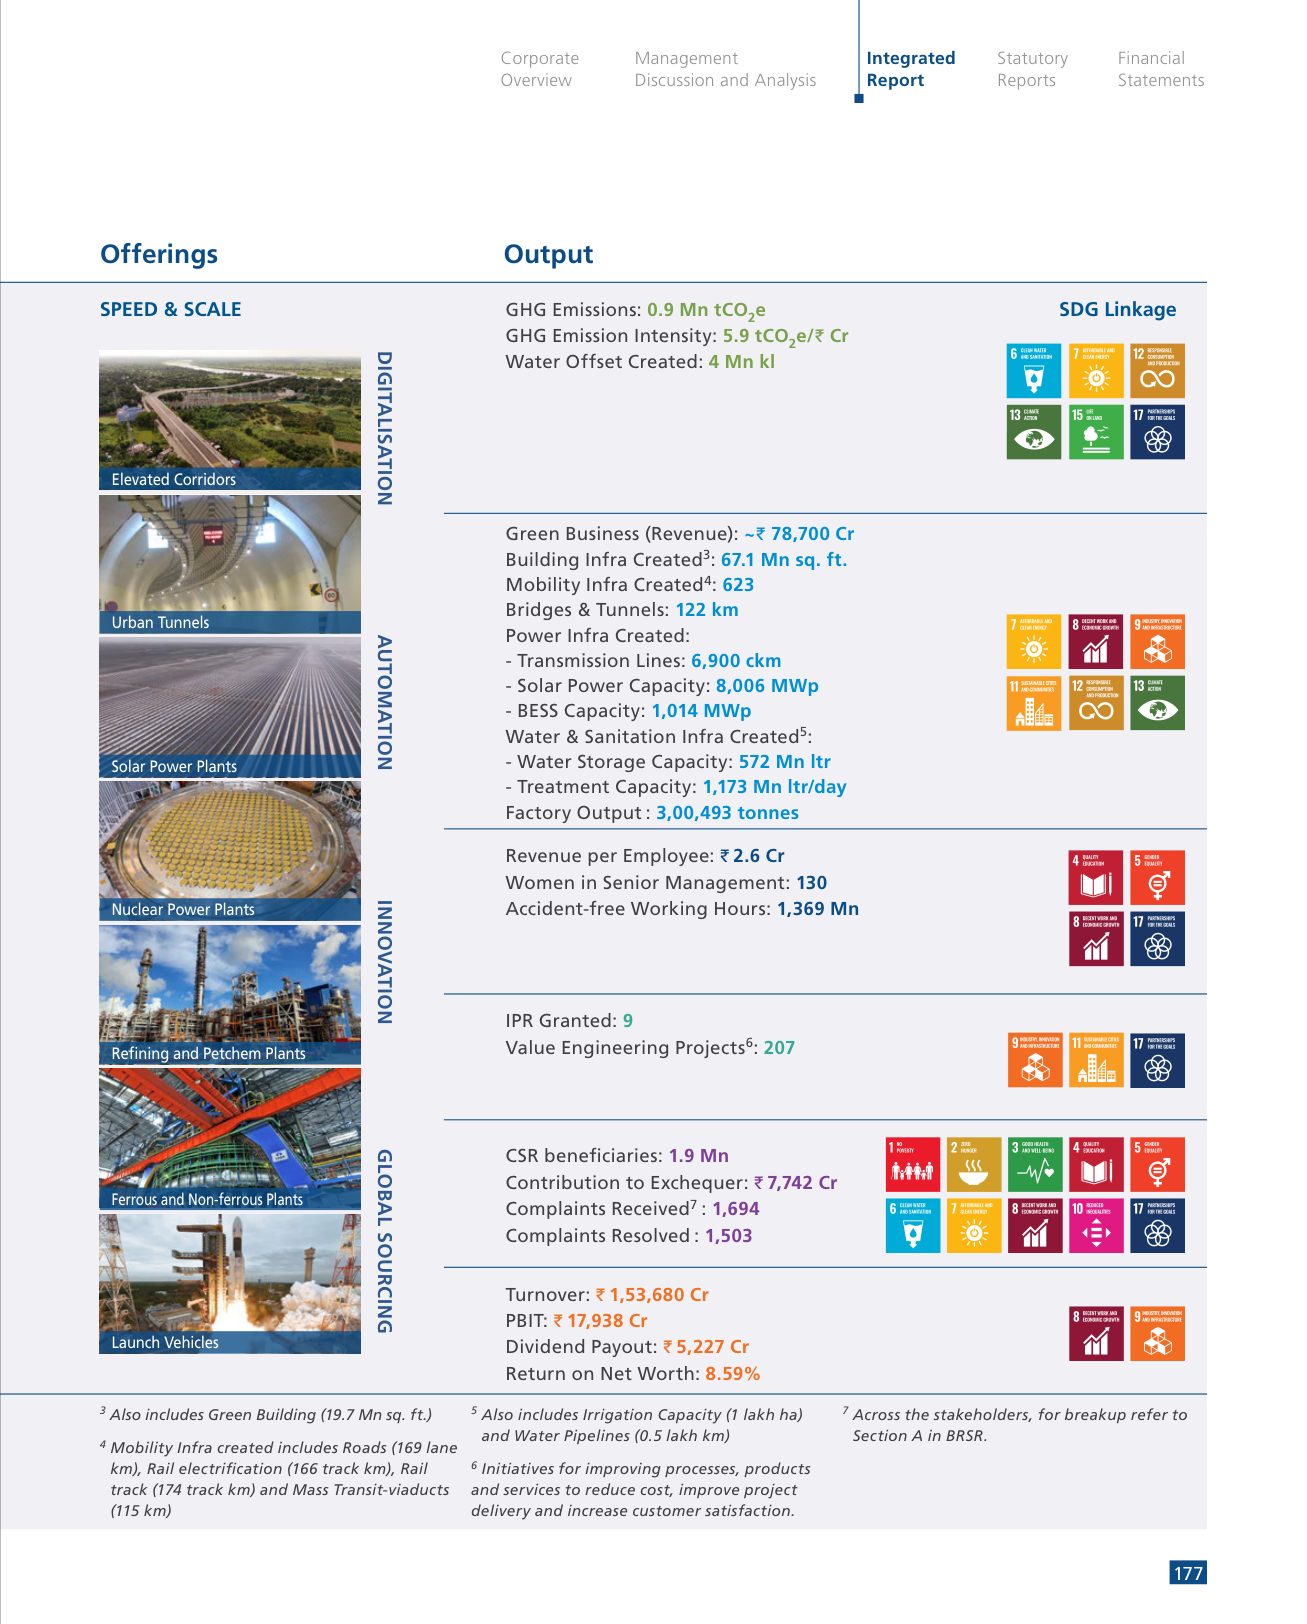
Two things distinguish it from the other strong models in the series. The natural capital inputs are physical (tonnes of cement, not rupees), which is what the Framework intends and which almost nobody does. And the financial output uses the statutory return on net worth, 8.59%, not a recurring figure. The capital chapters that follow open with the material topics and SDGs that apply, and run to real depth (natural capital alone is thirty pages). Connectivity is shown, not asserted.
BRSR and ESG integration: 5/5
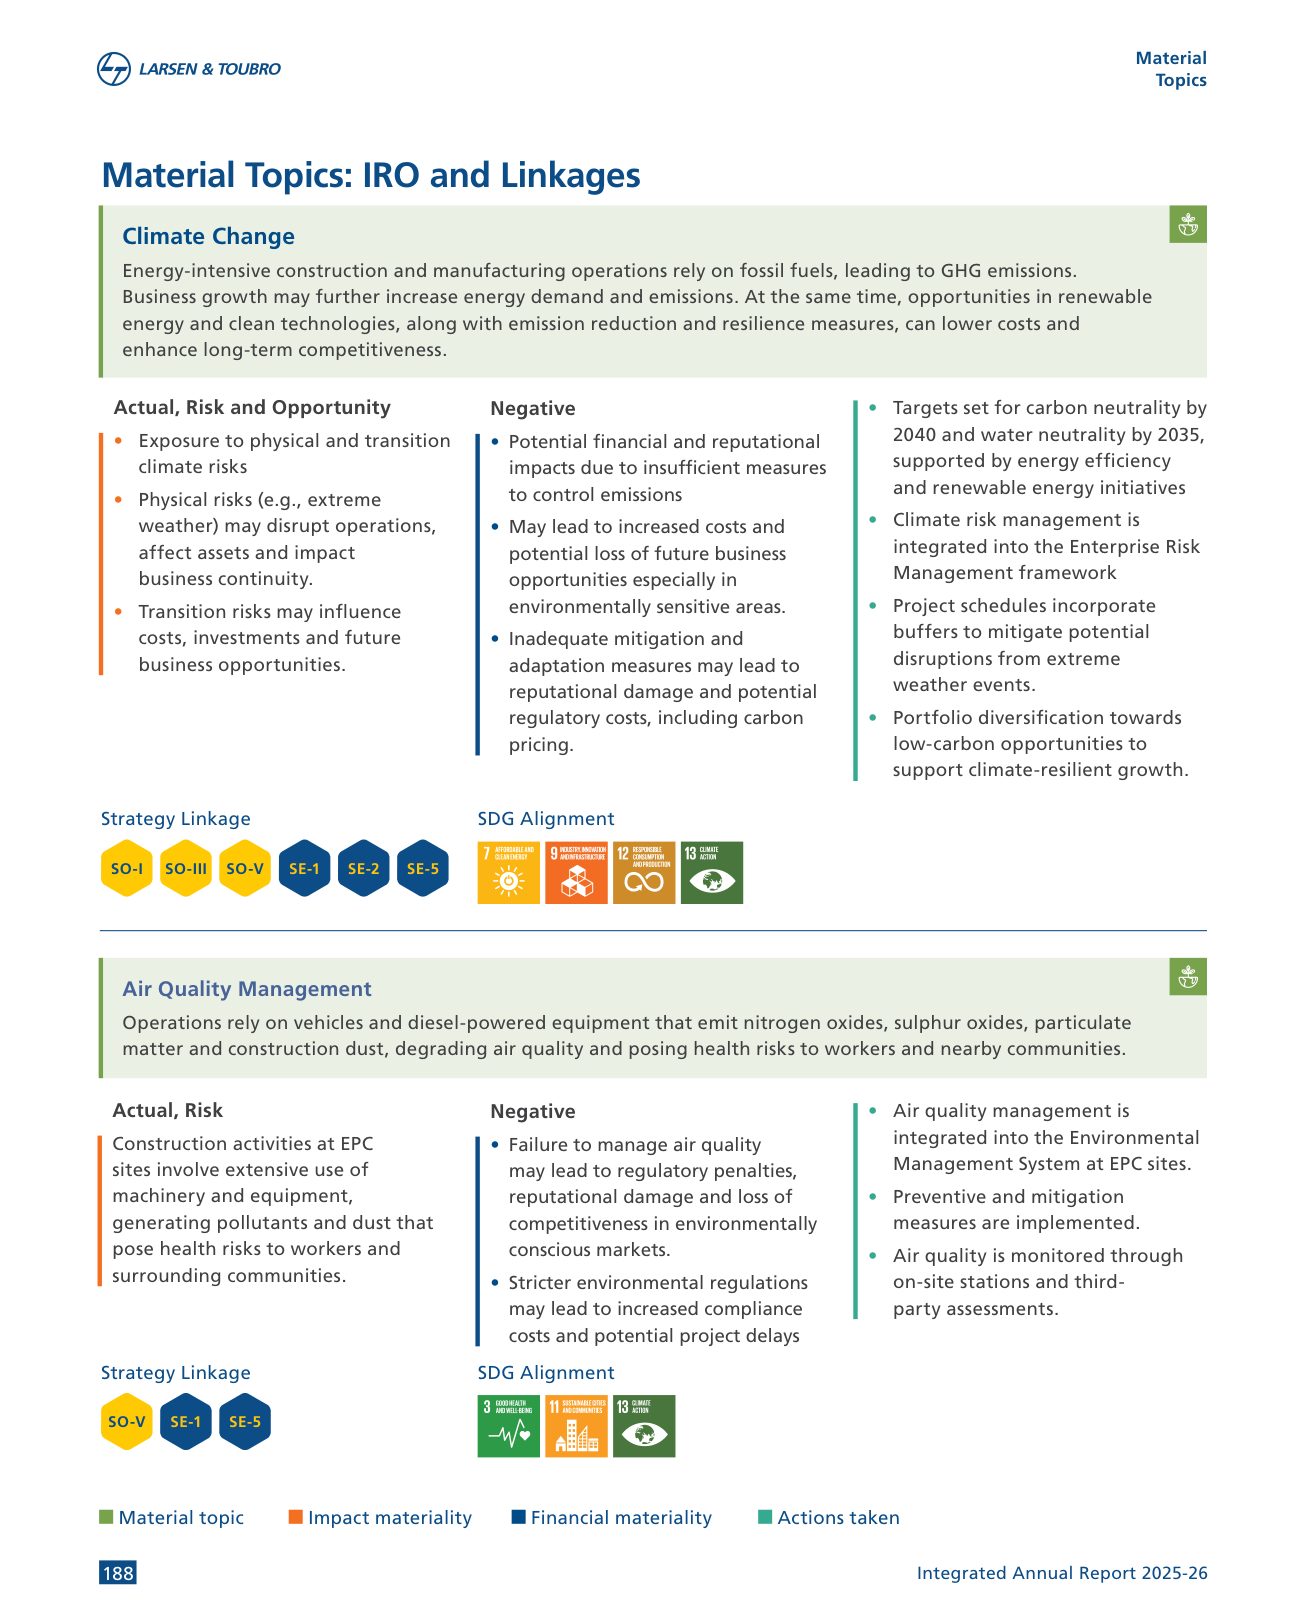
Materiality is the best-documented in the series after HDFC Bank, and better dated. The report states that L&T undertook its first double materiality assessment in FY 2025-26, conducted by an independent third party and guided by ESRS and GRI 2021, aligned with BRSR and referencing IFC Performance Standards, SASB and ILO guidelines. Impact materiality is scored on scale, scope and irremediability; financial materiality on effect on the business. A full reassessment is committed every three years, with annual reviews. The material topics are then presented as a table of impacts, risks and opportunities with their linkages, and each capital chapter lists the topics it addresses.
Climate disclosure is structured on IFRS S1 and S2 and TCFD, with a multi-tier governance framework, and the emissions data is complete: Scope 1 of 6,17,113 tCO2e (including 10,941 tCO2e of fugitive emissions), Scope 2 of 2,89,920 tCO2e market-based, and Scope 3 across nine of the fifteen GHG Protocol categories with prior-year comparatives, purchased goods and services at 6.38 million tCO2e being by far the largest. Diesel at project sites accounts for over 95% of Scope 1 and 2, and the report describes a diesel reduction task force, which is the right thing to be specific about.
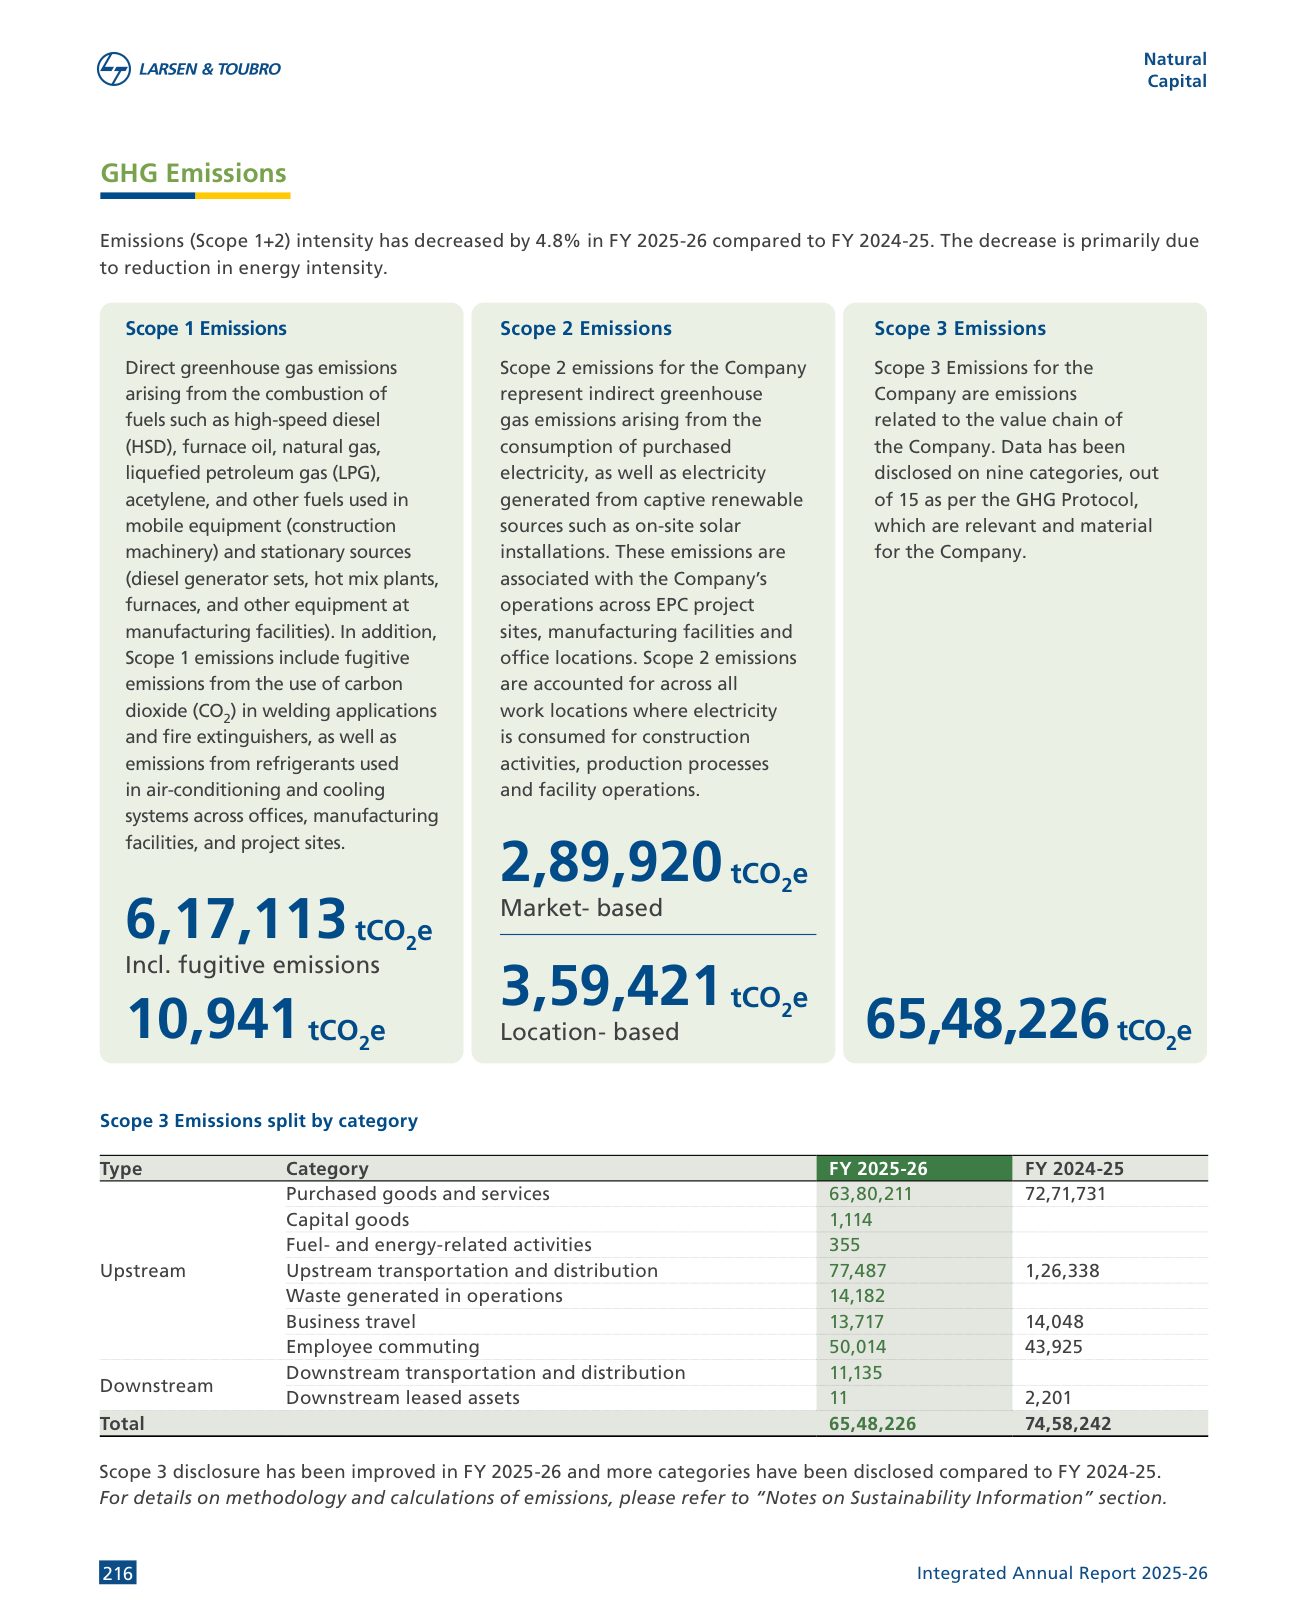
The targets are carbon neutrality by 2040 and water neutrality by 2035. For a company whose Scope 3 is roughly seven times its Scope 1 and 2, a value-chain target would complete the picture; the ESRS-aligned materiality work suggests one is coming. BDO India provides reasonable assurance on BRSR Core under ISAE 3000, continuing a practice the report says began in FY 2023-24.
Governance disclosure: 4/5
The sustainability governance chapter draws the structure from Board to business, the Board's report and its annexures are complete, and the combined Chairman and Managing Director role is stated in the signature of the message. The corporate governance report is in the statutory section. The score would rise with a statement of Board responsibility for the integrated report and a summary of board evaluation outcomes.
Financial storytelling: 4/5
The standalone results table on page 47 is the model for how to present an exceptional year.
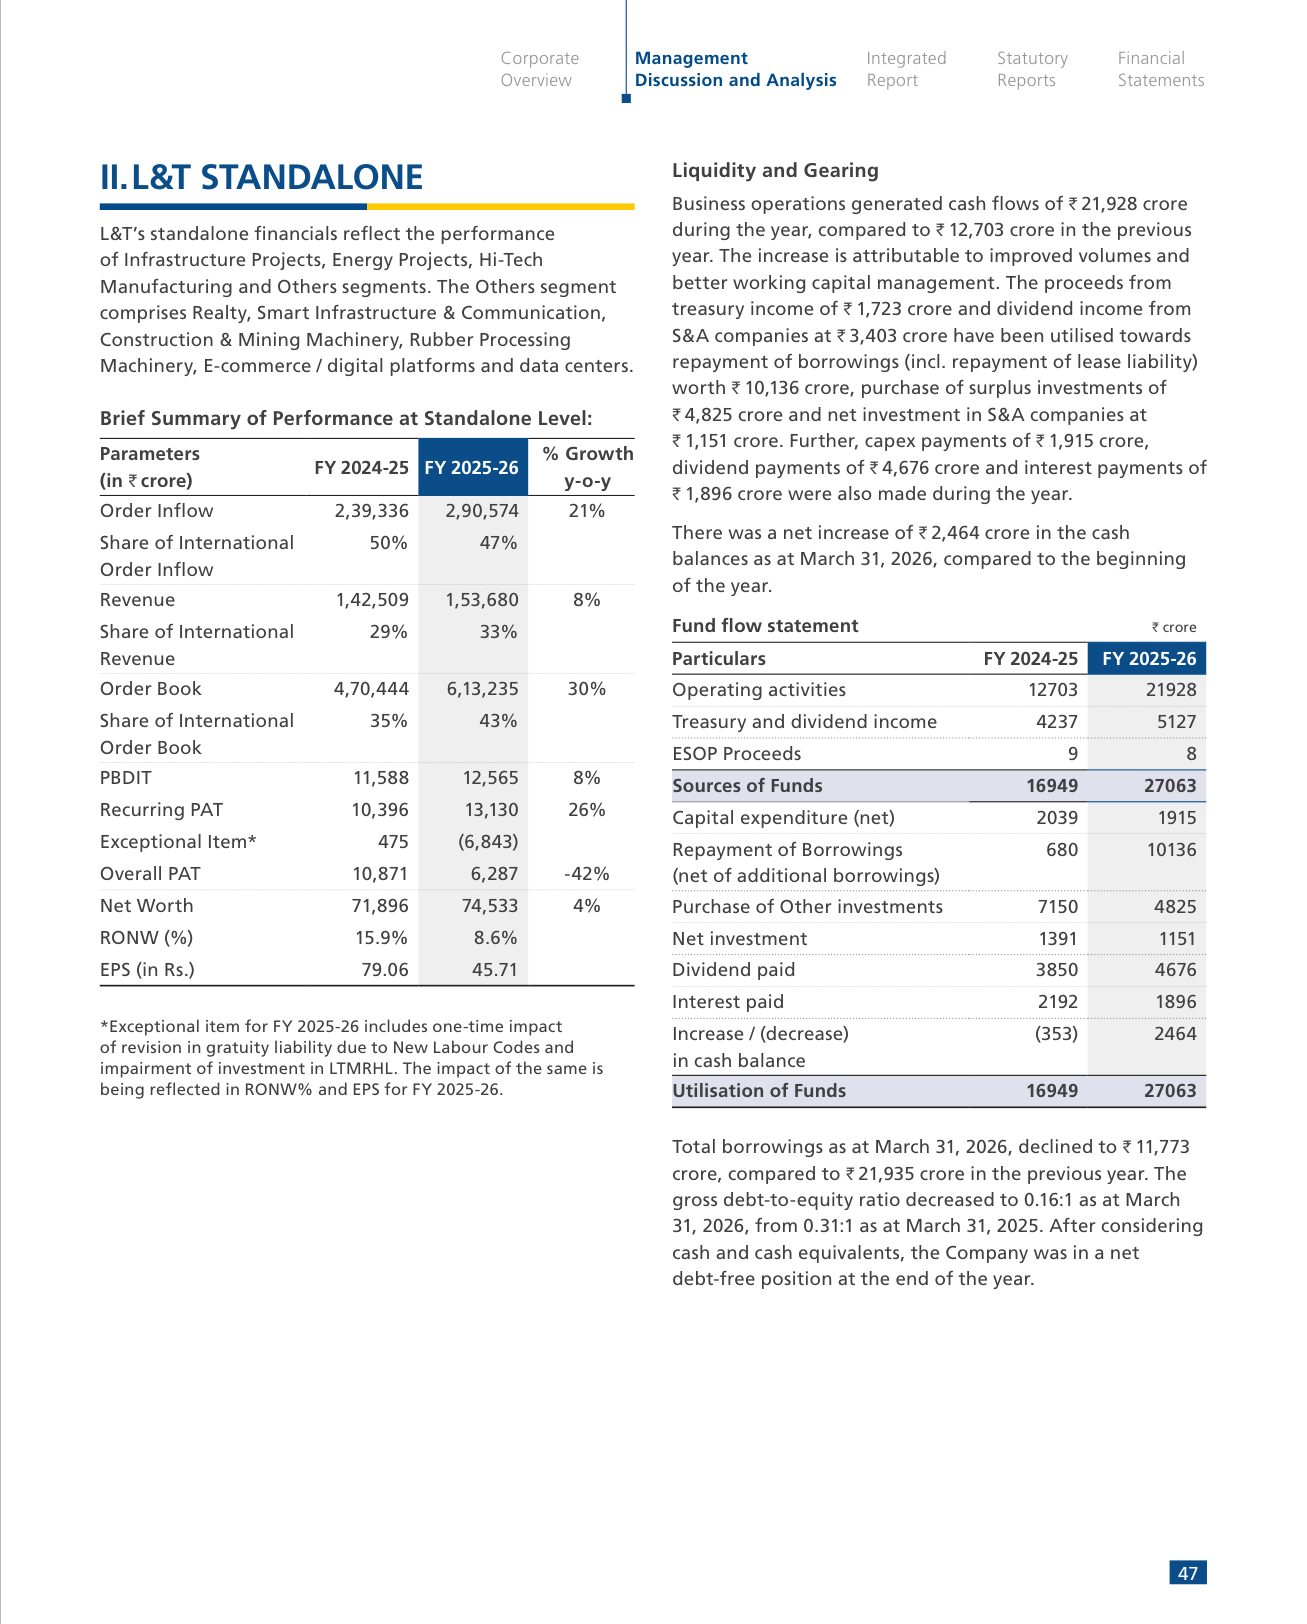
Order inflow ₹2,90,574 crore (up 21%), revenue ₹1,53,680 crore (up 8%), order book ₹6,13,235 crore (up 30%), PBDIT ₹12,565 crore (up 8%), Recurring PAT ₹13,130 crore (up 26%), Exceptional Item ₹(6,843) crore, Overall PAT ₹6,287 crore (down 42%), RONW 8.6% against 15.9%, EPS ₹45.71 against ₹79.06, with a footnote naming the two components of the exceptional item. The ten-year highlights table carries both PAT lines, "excluding exceptional items" and "including", for all ten years. Consolidated PAT is given as ₹16,084 crore, up 7.0%. Nobody reading the MD&A can be confused about what happened.
The point dropped is the corporate overview, which leads with Group "Recurring PAT" of ₹17,238 crore, up 18%, and the Chairman's message, which repeats it. Recurring measures are useful; leading with them in a year when the statutory number halved, without a line saying so, is a choice the MD&A's own table makes look unnecessary.
Design and readability: 2/5
The page furniture is good (five section tabs on every page, a consistent grid), and the integrated report's chapters are well organised. The problem is the order and the volume. A reader opens the PDF, passes the credo and the Chairman's message, reaches the contents on page 14, and then encounters 146 pages of business-by-business MD&A before the value creation model on page 176. The integrated report, the part that explains how the company creates value, starts on page 172 of 754. Reversing the order, or moving the MD&A's business detail into the capital chapters, would halve the length and double the readership.
Digital version: 4/5
The bookmark tree is complete and correctly labelled, the PDF is single pages, and the section tabs make navigation possible. There is no QR link or reference to an online integrated report in the PDF; the stakeholder satisfaction survey form at page 751, to be printed and posted, suggests where the digital thinking stops.
What reporting teams can take from it
Copy the value creation model, including physical inputs in tonnes and the statutory return figure in outputs. Copy the results table with recurring, exceptional and overall profit on adjacent lines, and carry both lines through the ten-year table. Copy the materiality chapter: third party, dated, ESRS-aligned, with impacts, risks and opportunities tabulated.
Then put the integrated report before the MD&A, cut the MD&A into the capital chapters, and make sure the Chairman's letter mentions the biggest number in the accounts, even when it is a negative one.
Series scorecard
Every report in this series is scored on the same seven-point card by the same reader. Scores are editorial opinion of the published document; each review carries the page references behind its findings.
| Company | Score (of 35) |
|---|---|
| Hindustan Zinc | 30 |
| TCS | 29 |
| HUL | 28 |
| Reliance | 27 |
| L&T (this review) | 27 |
| Bharti Airtel | 27 |
| HDFC Bank | 26 |
| ICICI Bank | 25 |
| Infosys | 25 |
| ITC | 21 |
Frequently asked questions
How is L&T's annual report structured?
As five sections: Corporate Overview (Chairman's message, group structure, network, ten-year highlights), a 146-page Management Discussion and Analysis covering each business, a 175-page Integrated Report (value creation model, stakeholder engagement, materiality, sustainability governance and six capital chapters), the BRSR, and Statutory Reports and Financial Statements. The whole PDF is 754 pages.
What was L&T's exceptional item in FY 2025-26?
A standalone charge of ₹6,843 crore comprising a one-time revision in gratuity liability under the new Labour Codes and an impairment of the investment in L&T Metro Rail (Hyderabad) Limited, which the company agreed to sell to Hyderabad Metro Rail Limited, a Government of Telangana enterprise, under a share purchase agreement of 29 April 2026. Recurring PAT was ₹13,130 crore, up 26%; overall PAT was ₹6,287 crore, down 42%. Consolidated PAT was ₹16,084 crore, up 7.0%.
Does L&T do a double materiality assessment?
Yes, for the first time in FY 2025-26. The assessment was conducted by an independent third party, guided by the European Sustainability Reporting Standards and GRI Standards 2021, aligned to SEBI's BRSR and referencing IFC Performance Standards, SASB and ILO guidelines. Impact materiality was scored on scale, scope and irremediability; financial materiality on the effect on the business. The company reassesses fully every three years with annual reviews.
What are L&T's emissions and climate targets?
Scope 1 emissions of 6,17,113 tCO2e including 10,941 tCO2e of fugitive emissions; Scope 2 of 2,89,920 tCO2e on a market basis; and Scope 3 disclosed across nine GHG Protocol categories, the largest being purchased goods and services at about 6.38 million tCO2e. Diesel at project sites accounts for over 95% of Scope 1 and 2. The targets are carbon neutrality by 2040 and water neutrality by 2035, with climate risk handled under an IFRS S1/S2 and TCFD-aligned framework.
Who assures L&T's BRSR?
BDO India Services Pvt. Ltd. provides independent reasonable assurance on BRSR Core parameters under ISAE 3000. The report states L&T has obtained reasonable assurance on selected BRSR Core indicators since FY 2023-24.
How does The Footnotes score annual reports?
Seven criteria, each scored 1 to 5 with a one-line reason: strategy and narrative; integrated thinking and capitals; BRSR and ESG integration; governance disclosure; financial storytelling; design and readability; and the digital version. Scores are editorial opinion based on the published document, and the same card is used for every company so results can be compared.
Sources
- Larsen & Toubro — Integrated Annual Report 2025-26 (PDF) — Larsen & Toubro Limited
- Larsen & Toubro — Investors — Larsen & Toubro Limited
- Integrated Reporting Framework (IFRS Foundation) — IFRS Foundation
- SEBI circular: BRSR Core — framework for assurance and ESG disclosures for value chain (12 July 2023) — SEBI