

TCS Integrated Annual Report 2025-26: A Review
TCS publishes the most complete integrated business model in the Nifty 50 and a targets-to-status natural capital page others should copy, but its headline profit growth excludes ₹3,366 crore of exceptional items that a reader only finds on page 197.
 In short
Key takeaways
- TCS's report is a 383-page integrated annual report with the BRSR (pages 135 to 186) and GRI index inside it rather than in a separate document, plus a stand-alone IFRS S2 climate report linked from the risk section.
- The Integrated Business Model spread (pages 42-43) is the strongest in the series so far: inputs by capital on the left, five value-creation activities in the middle, outputs and outcomes by capital on the right, all with numbers.
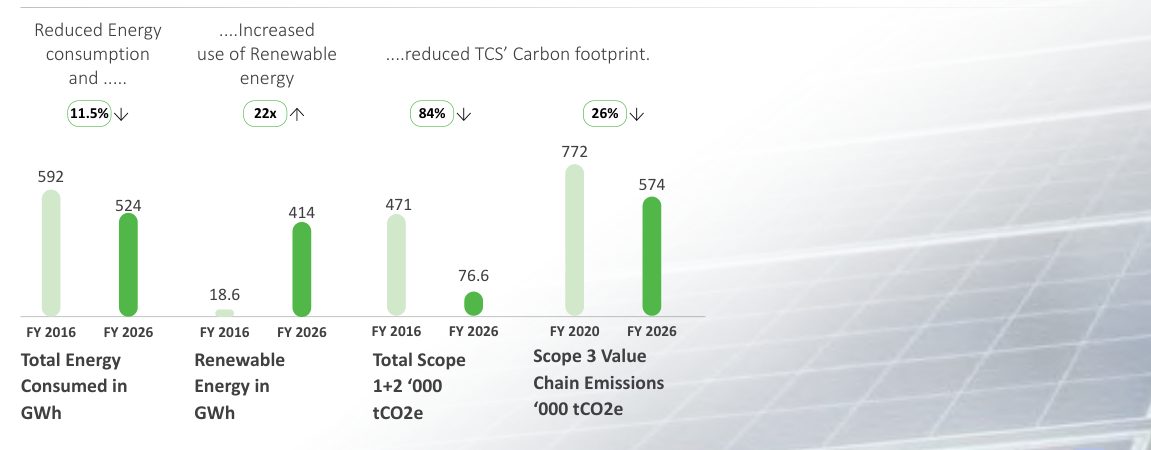
- Natural capital is reported as Aalingana goal → TCS target → FY 2026 status: Scope 1+2 down 84% against a 90%-by-FY2030 SBTi target, Scope 3 down 26% against 35% by FY2034, 79% renewable energy, 99% treated water reused.
- Every non-statutory figure excludes exceptional items — ₹2,128 crore of Labour Code impact, ₹1,388 crore of termination benefits, and a US$112 million provision for the CSC lawsuit. Statutory profit for the year was ₹49,454 crore (up 1.3%); the report's headline net income is ₹52,820 crore (up 8.8%).
- Constant-currency revenue fell 2.4% in FY 2026; the reported 4.6% growth is a currency effect. The report says so, but only in the financial capital chapter, not on the highlights page.
- KPMG provides reasonable assurance on BRSR Core attributes and limited assurance on other selected BRSR and GRI indicators; the PDF's bookmarks expose internal file names including 'Draft 1', a small production slip in an otherwise polished document.
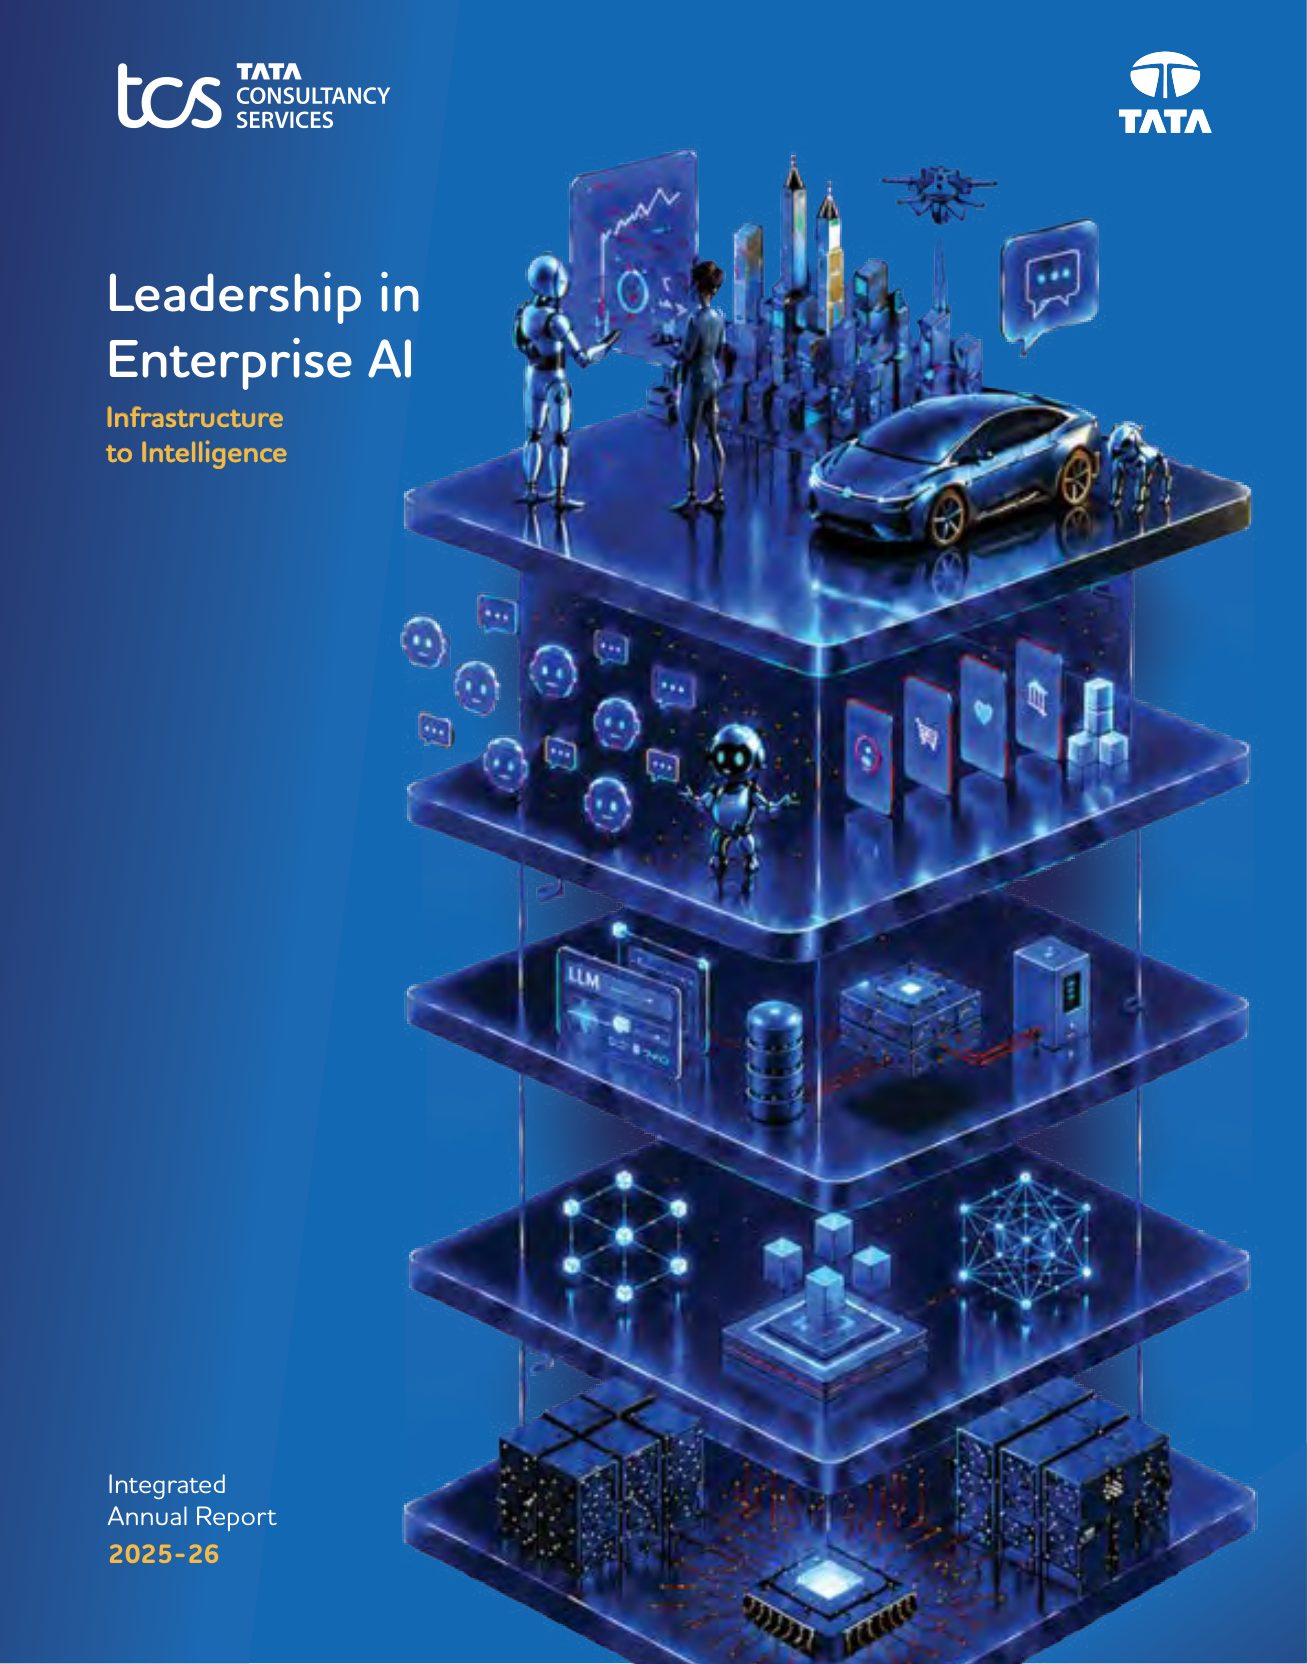
Tata Consultancy Services has published an integrated annual report for longer than almost any Indian company, and it shows. The FY 2025-26 edition, themed "Leadership in Enterprise AI: Infrastructure to Intelligence", is 383 pages including the BRSR, the GRI index and KPMG's assurance reports, and it is the most complete execution of the <IR> Framework we have seen in this series. It also makes one presentational choice that every reader should understand before quoting a number from it.
As with every review in this series, we read the published PDF against the <IR> Framework, SEBI's BRSR Core expectations and plain readability, and score it on the same seven-point card. Scores are our opinion. Screenshots are small excerpts reproduced for review and remain the copyright of Tata Consultancy Services; the full report is on the company's investor relations pages.
The scorecard
| Criterion | Score (of 5) | In one line |
|---|---|---|
| Strategy and narrative | 4 | One strategy (full-stack AI), five pillars, and letters that report against them; thematic section runs long |
| Integrated thinking and the capitals | 5 | The business-model spread is the reference example; capitals chapters carry inputs, outcomes and GRI tags |
| BRSR and ESG integration | 4 | BRSR inside the report, SBTi targets with status, reasonable assurance on Core; materiality process described but undated |
| Governance disclosure | 4 | Complete Schedule V disclosure, tax strategy page; skills matrix is prose |
| Financial storytelling | 3 | Five-year charts are excellent; excluding exceptional items from every non-statutory number is a choice readers must be told about earlier and louder |
| Design and readability | 4 | Consistent chapter system, good charts, clear page furniture; a few spreads are dense |
| Digital version | 4 | Single-file PDF with working bookmarks, QR link to the online report; bookmarks leak internal file names |
| Total | 29 / 35 |
What the report is
Everything is in one document. The corporate overview and thematic section run to page 41, the capitals to page 64, then the Board's report, MD&A, corporate governance report and the BRSR (pages 135 to 186), the consolidated and standalone financial statements, the AGM notice, a glossary, the sustainability disclosures with a GRI content index, and KPMG's limited assurance report. A separate IFRS S2 climate report is linked from the risk section of the MD&A.
The "About the Report" page does the things the Framework asks: reporting period and entity, boundary (global owned and operated locations, value chain where specified), the frameworks used (<IR>, GRI, UNGC, UN SDGs, BRSR, Ind AS, LODR, Secretarial Standards), and audit and assurance (B S R & Co. for the financials; KPMG reasonable and limited assurance on BRSR data). It also contains the sentence that governs how the rest of the report should be read, which we come to under financial storytelling.
Key number: 383 — pages in a single PDF, with the BRSR, GRI index and assurance reports inside the integrated report rather than published separately.
Strategy and narrative: 4/5
TCS states one aspiration, to become "the world's largest AI-led technology services company", one strategy (full-stack AI services from infrastructure to intelligence), and five transformation pillars: tcsAI, redefining services, a future-ready talent model, making AI real for clients, and an AI ecosystem play. The CEO's letter then reports against each pillar with numbers: 281,000 hackathon participants; a Services Transformation unit; 69 million learning hours and 270,000 employees with advanced AI skills; a 12-to-16-week AI acceleration playbook; and the Coastal Cloud (US$700 million) and ListEngage acquisitions plus the HyperVault data-centre venture with TPG. That is what a strategy section should look like: claims that can be checked next year.
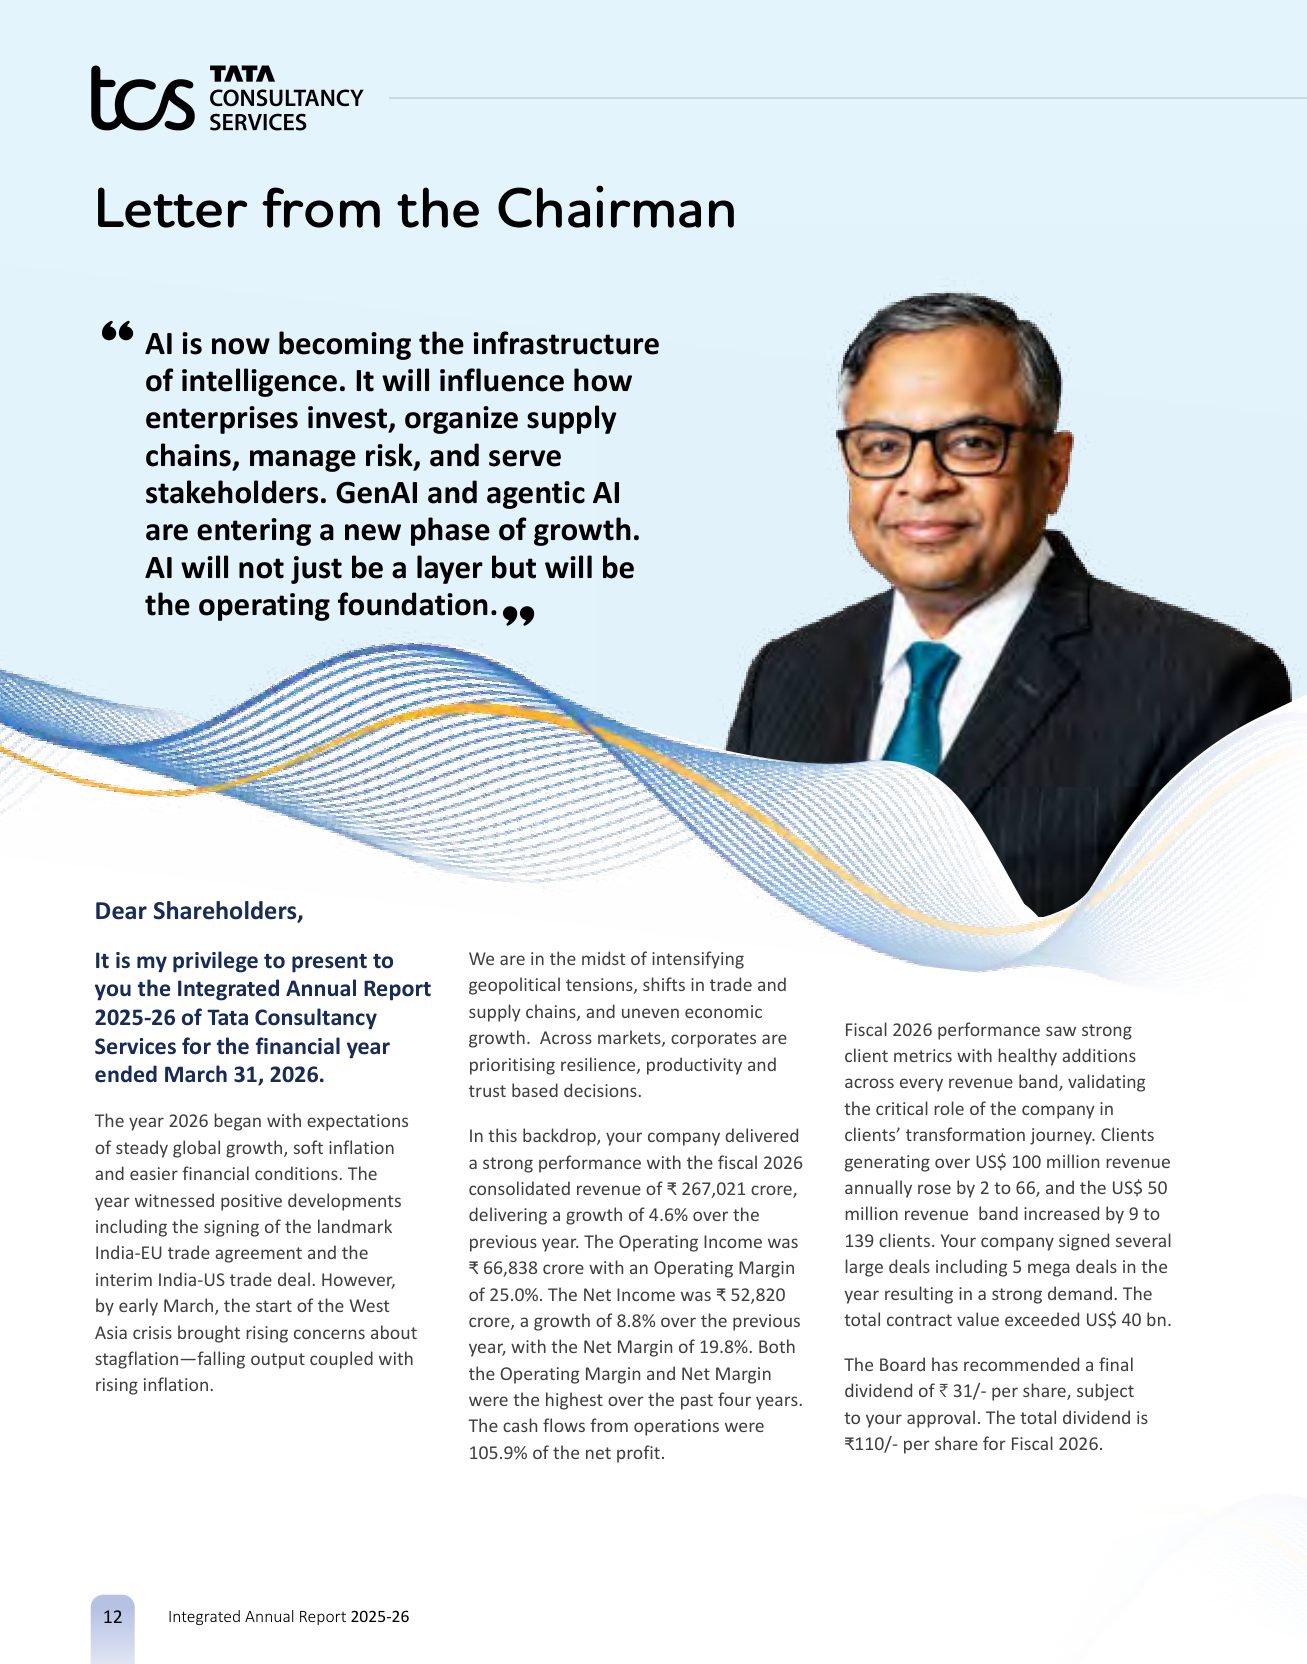
The Chairman's letter is shorter and adds the year's hard facts: revenue of ₹267,021 crore (up 4.6%), operating margin of 25.0%, five mega deals, total contract value above US$40 billion, and a ₹110 per share total dividend including a ₹46 special dividend. It closes with four focus areas: an AI operating system for industries, India's first AI-focused data centre with rack density above 160 kW, 360-degree partnerships, and sovereign AI infrastructure.
Where the narrative loses a point is length and repetition. The thematic section on enterprise AI runs from page 16 to page 41, and several passages (the "95% of enterprises are in early AI adoption" framing, the system-integrator history) restate what the letters already said. A reader who wants the strategy has it by page 15.
Integrated thinking and the capitals: 5/5
This is the page we will point other reporting teams to.
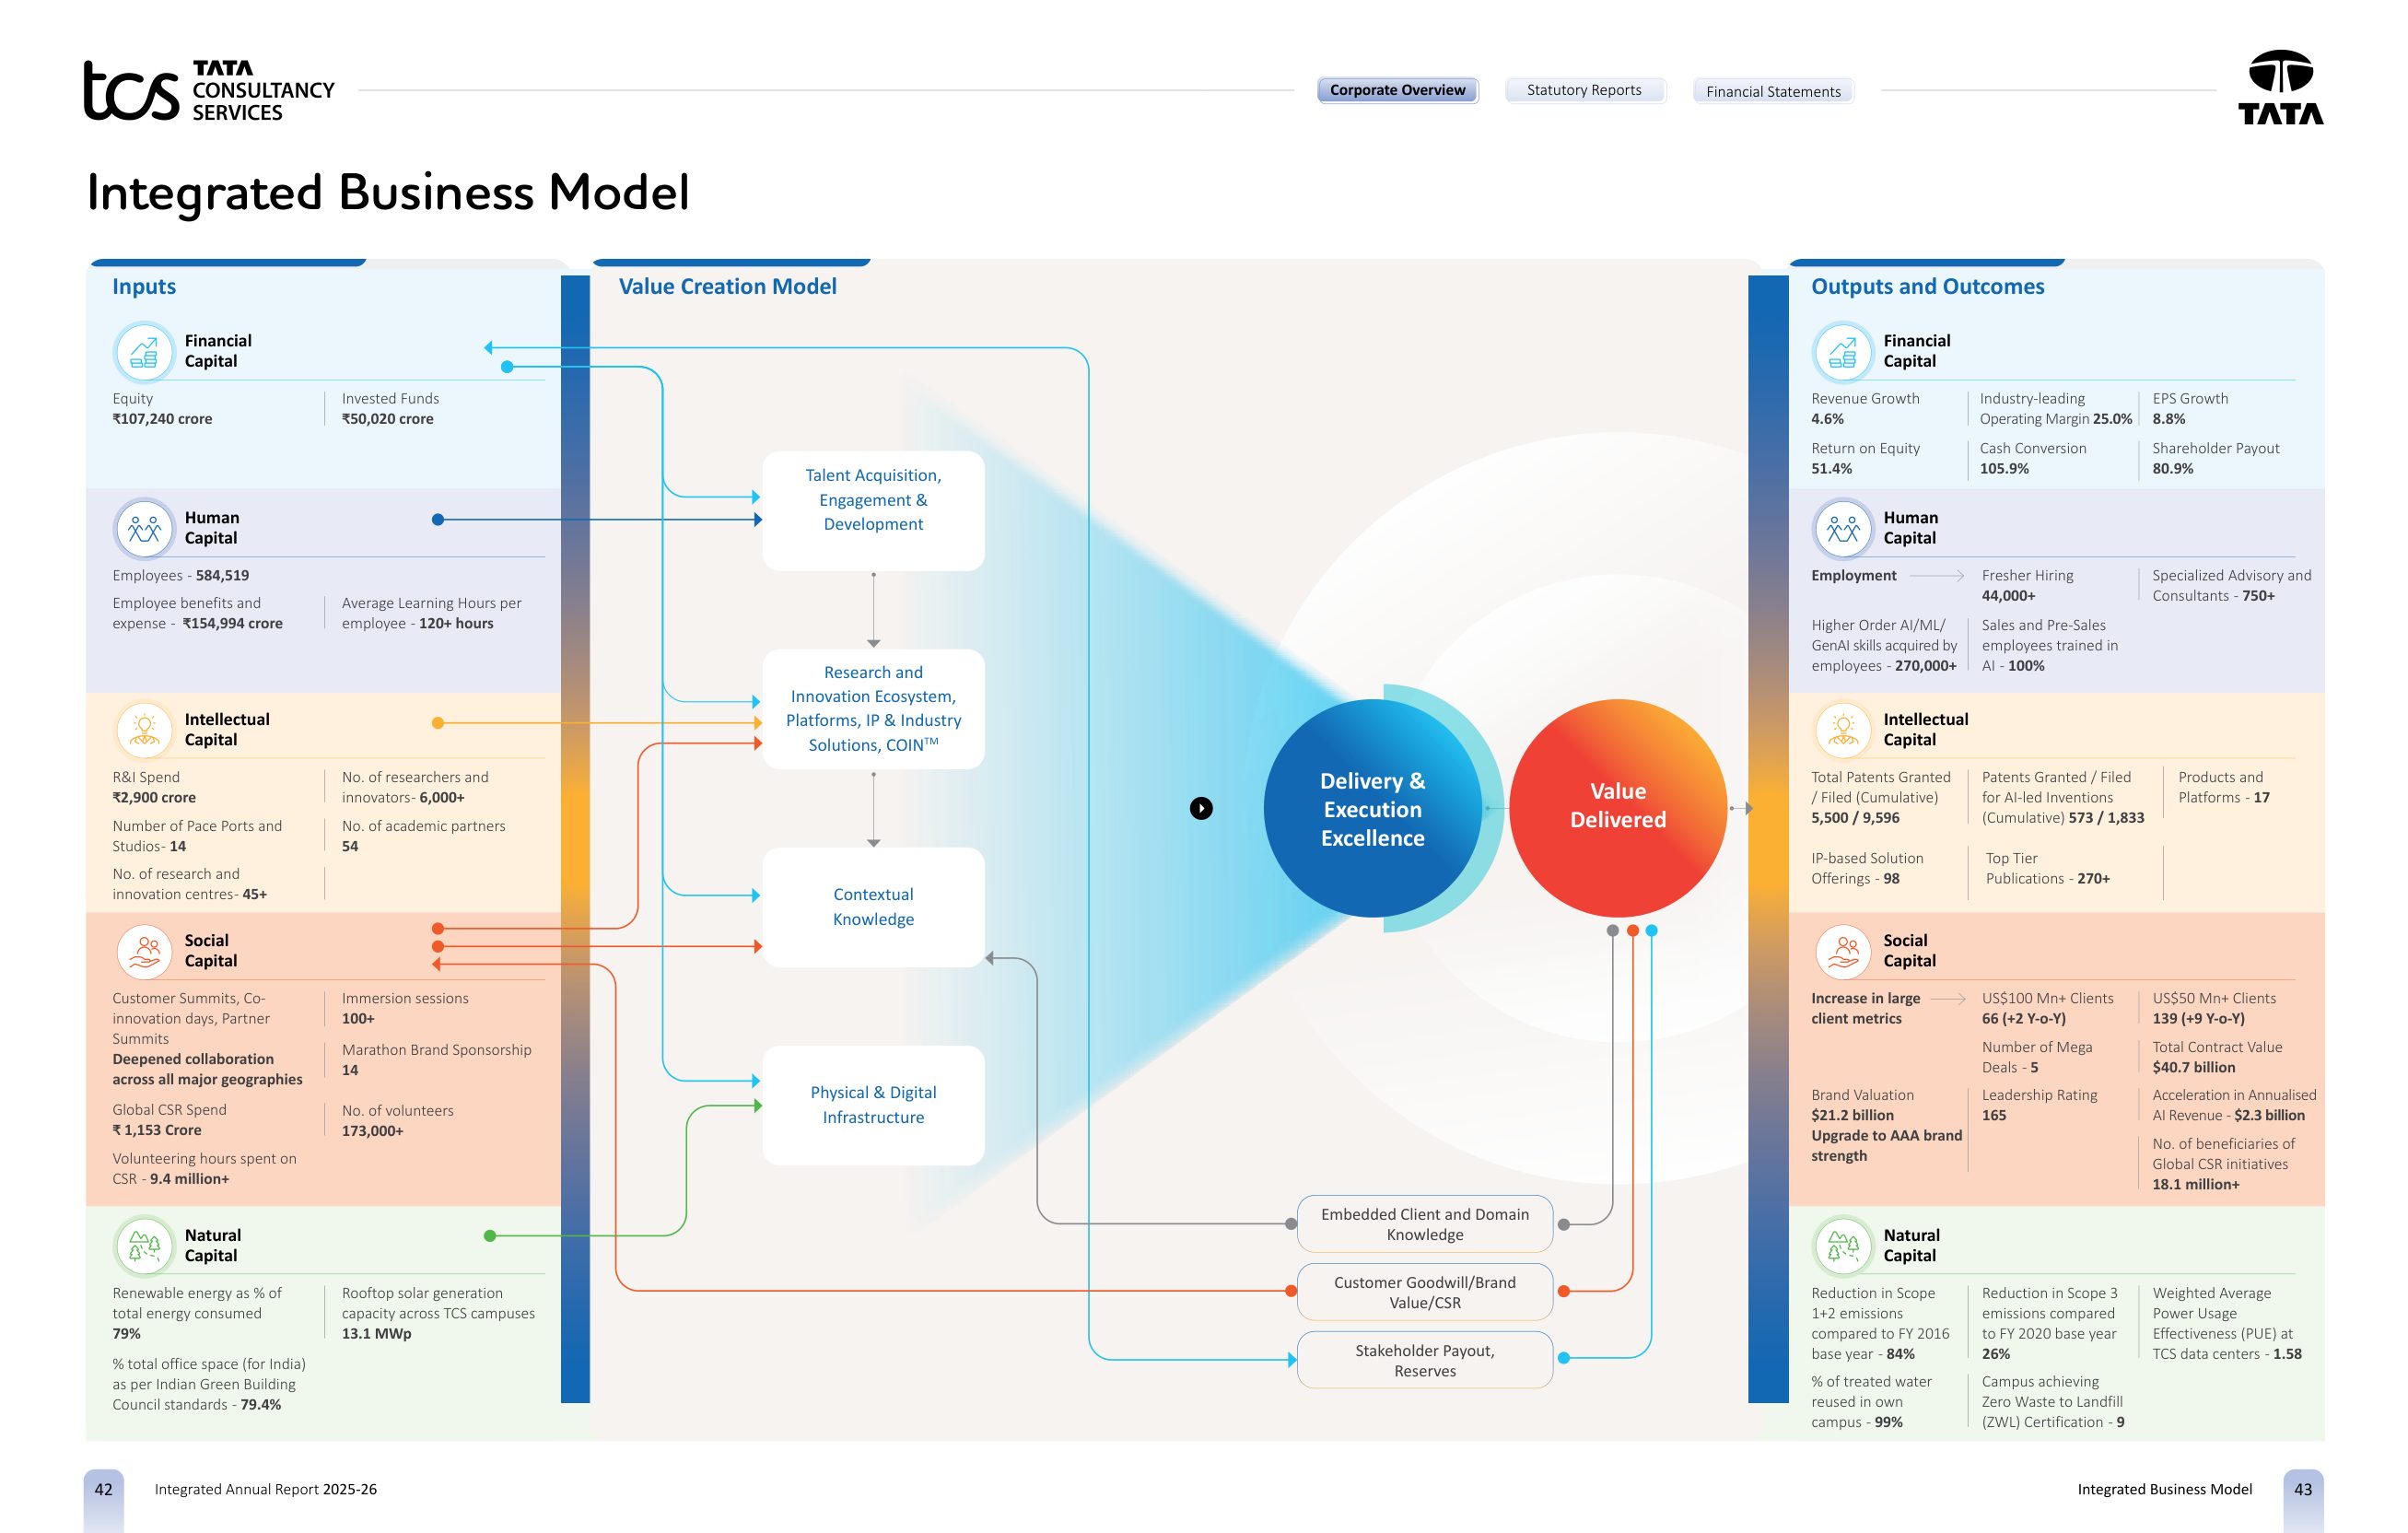
The left column lists inputs for each capital with numbers: ₹107,240 crore of equity and ₹50,020 crore of invested funds; 584,519 employees and ₹154,994 crore of employee cost; ₹2,900 crore of research and innovation spend across 45-plus centres; ₹1,153 crore of CSR spend and 9.4 million volunteering hours; 79% renewable energy and 13.1 MWp of rooftop solar. The centre shows five activities (talent, research and innovation, contextual knowledge, physical and digital infrastructure, delivery and execution excellence) with arrows to the capitals they draw on. The right column shows outputs and outcomes by capital: 25.0% operating margin and 51.4% return on equity; 44,000-plus freshers hired and 270,000-plus employees with higher-order AI skills; 5,500 patents granted; 66 clients above US$100 million; Scope 1+2 down 84% from base year.
It is one spread, it is legible, and every box has a number. That is the <IR> Framework's business model concept executed as described, which almost no Indian report does. The individual capital chapters that follow keep the discipline, each opening with a GRI reference and closing with outcomes.
BRSR and ESG integration: 4/5
The natural capital page is the second thing to copy. It is laid out as three columns: the Tata Group's Aalingana goals, TCS's targets under each, and the FY 2026 status.
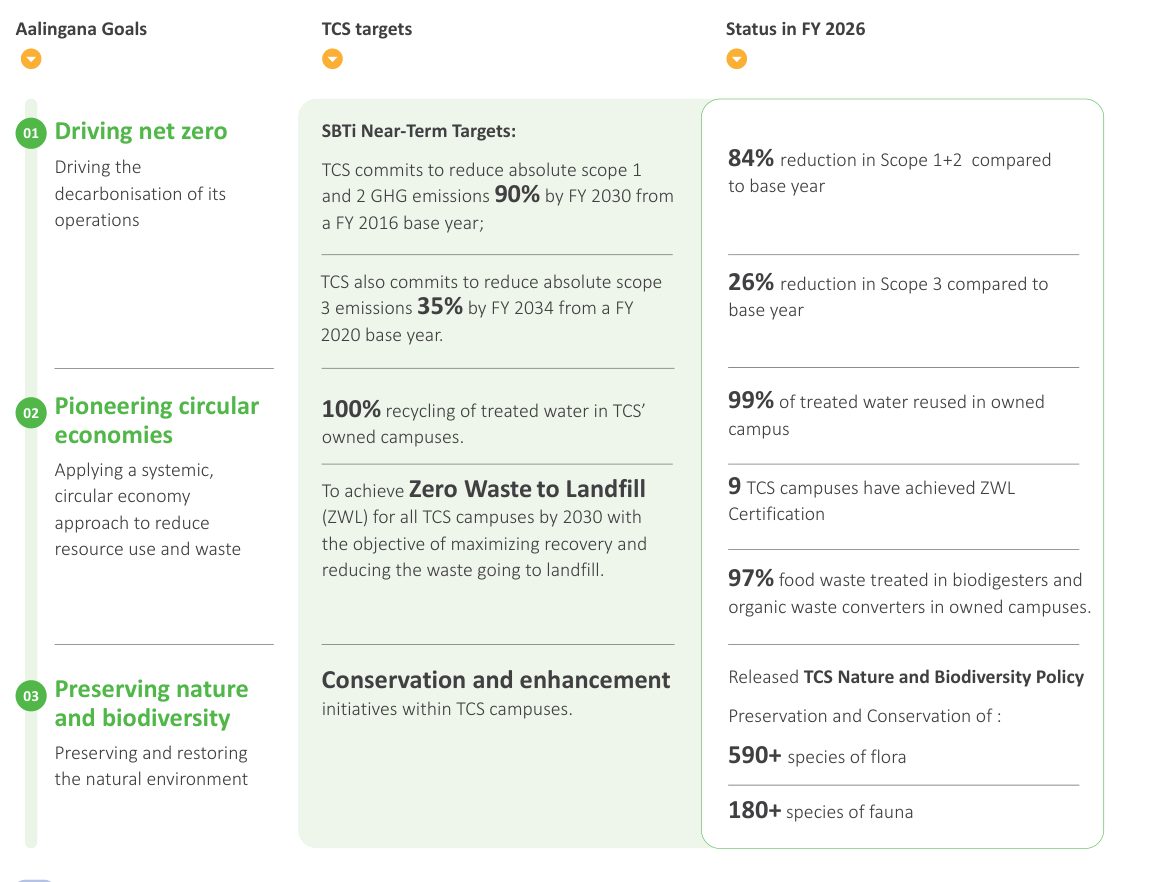
The targets are SBTi near-term commitments: cut absolute Scope 1 and 2 emissions 90% by FY 2030 from an FY 2016 base, and absolute Scope 3 emissions 35% by FY 2034 from FY 2020. Status: 84% and 26%. The supporting charts show the absolute numbers, which is what makes the percentages credible: Scope 1+2 from 471,000 to 76,900 tonnes CO2e; Scope 3 value-chain emissions from 772,000 to 574,000 tonnes; renewable energy from 18.6 GWh to 414 GWh; total energy from 592 GWh to 524 GWh.
Assurance is where TCS and Reliance are level: KPMG gives reasonable assurance on the BRSR Core attributes (report dated 15 May 2026) and limited assurance on other selected BRSR and GRI indicators. Placing the BRSR inside the integrated report, cross-referenced from each capital chapter ("BRSR, pages 162 to 176"), is the more reader-friendly of the two approaches.
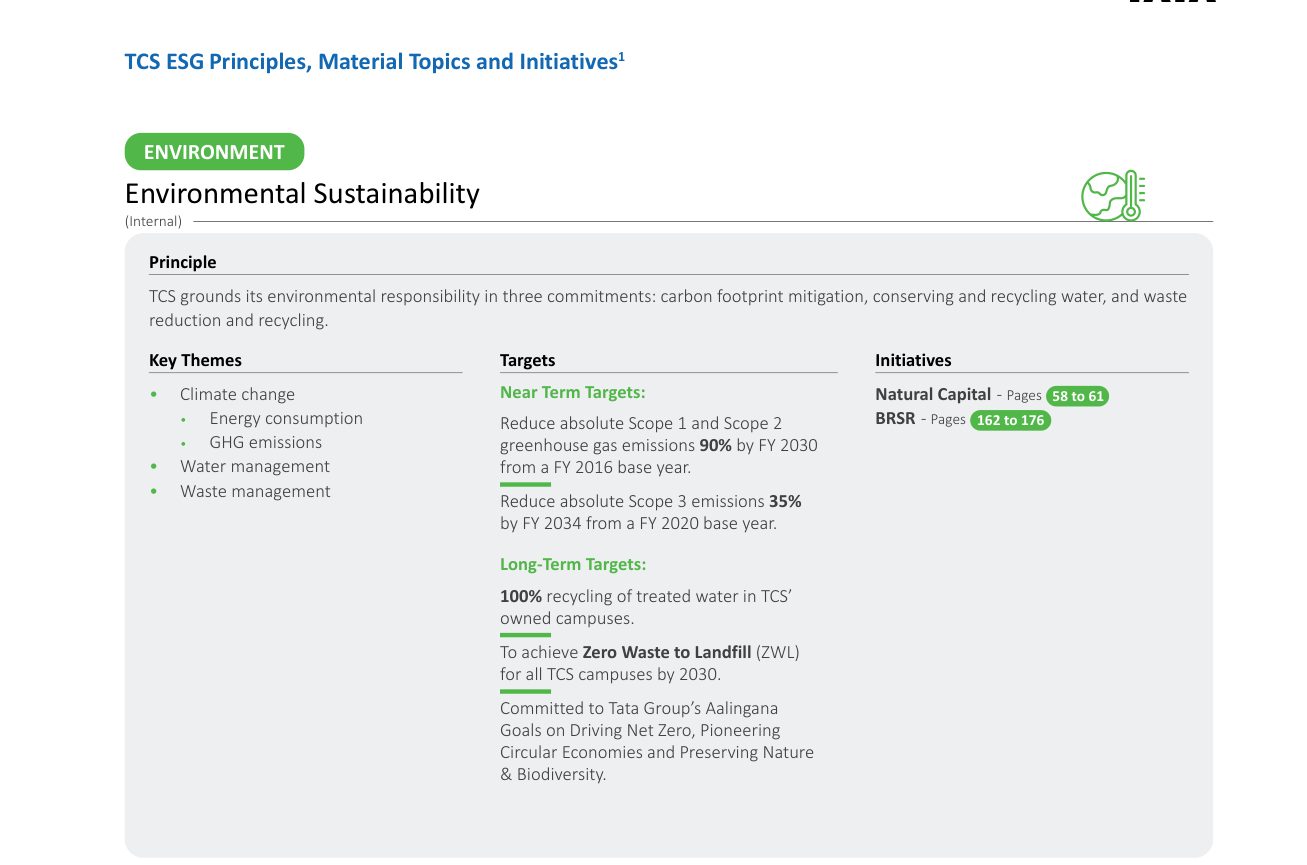
The point dropped is on materiality. The sustainability disclosures describe the process (stakeholder identification, engagement, data collection, identification of the universe of topics) and present each material topic with its principle, key themes, targets and page references. What it doesn't say is when the last assessment was done, who was consulted, or whether the AI pivot changed the list. "Periodic" is doing a lot of work in that section. It is a better position than Reliance's reference to a 2022-23 method, but a date and a short "what changed" paragraph would close the gap.
Governance disclosure: 4/5
The corporate governance report runs from page 101 and covers Schedule V fully: director profiles with other directorships and committee positions, meeting-by-meeting attendance, committee terms of reference and attendance, remuneration tables, and the familiarisation programme. Two things stand out as good practice. The report includes a tax strategy page (page 104) and, in the sustainability disclosures, lists country-wise income taxes with page references into the financial statements; few Indian reports treat tax as a stakeholder topic. And the CEO's letter carries a GRI 2-22 reference in its footer, which tells a GRI reader where the "statement on sustainable development strategy" lives.
What we'd want is a board skills matrix as a grid rather than prose, and evaluation outcomes rather than criteria.
Financial storytelling: 3/5
The five-year charts in the financial capital chapter are the best-drawn in the series: revenue with a 10.2% CAGR, operating profit with margin overlaid, EPS with a 10.3% CAGR, operating cash flow with cash conversion, shareholder payout with payout ratio, and return on equity. They tell a coherent story of a company that pays out most of what it earns and still grows earnings.
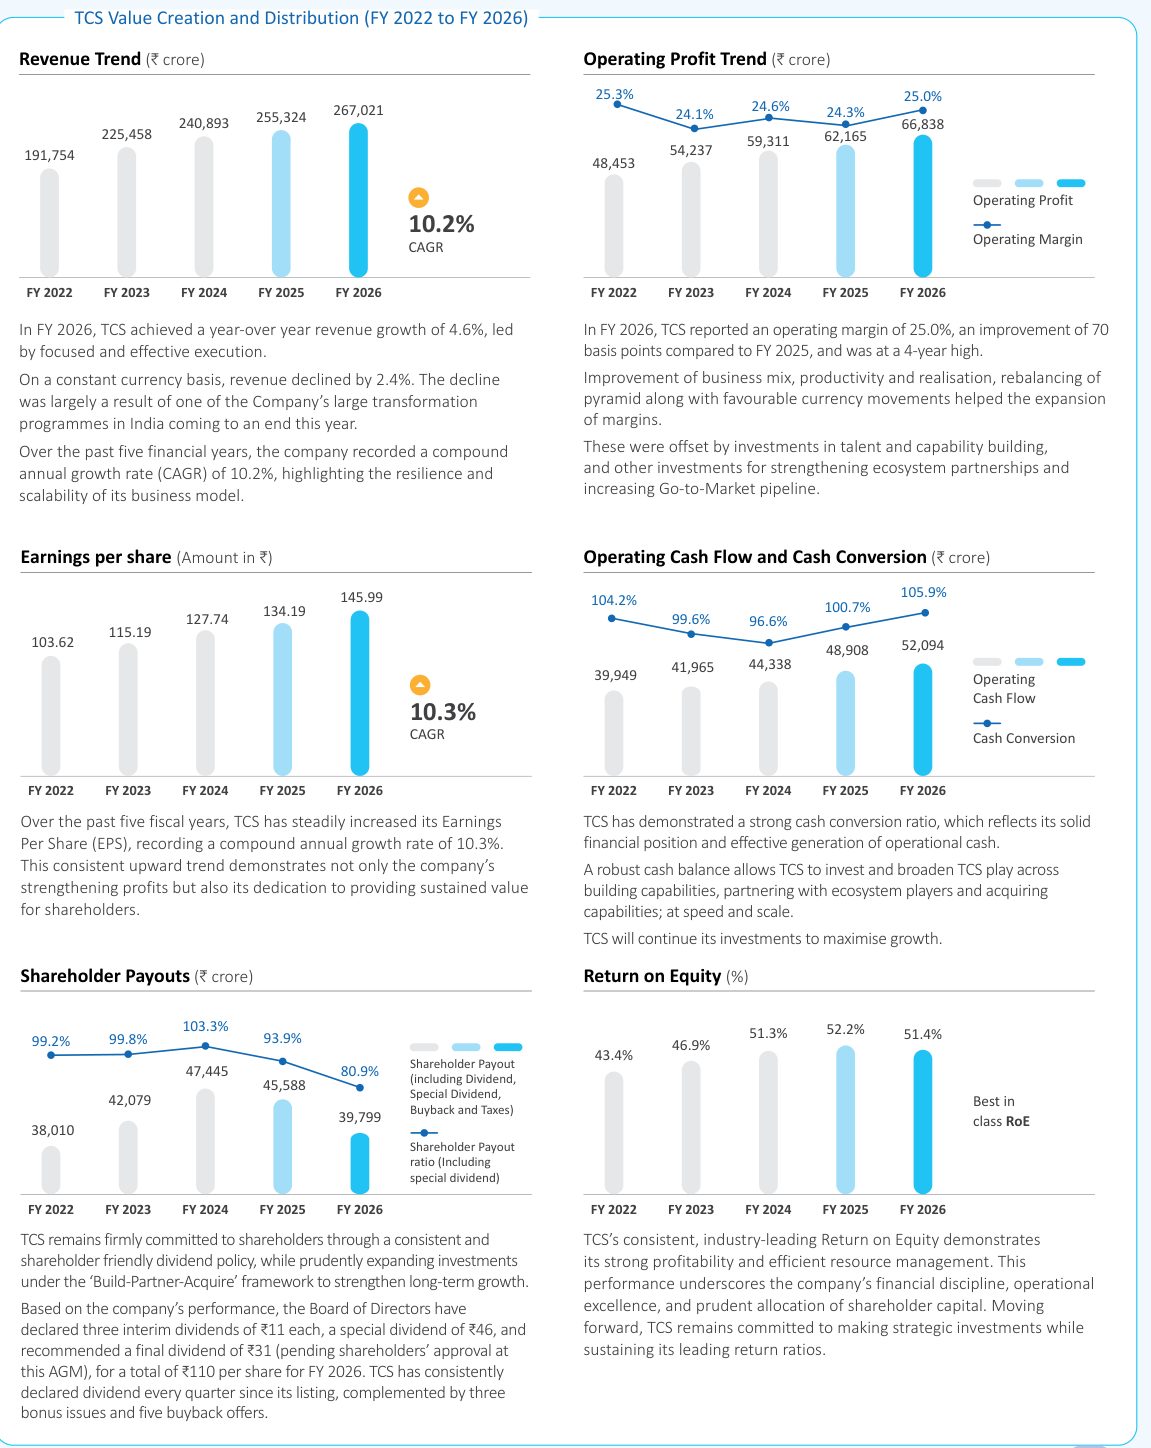
The chapter also states plainly that constant-currency revenue declined 2.4% and that the 4.6% reported growth reflects currency, because a large transformation programme in India ended. That candour is welcome. It sits on page 44, not on the highlights spread.
The score is a 3 because of the exceptional-items convention. The "About the Report" page says all figures in non-statutory sections exclude exceptional items: the ₹2,128 crore impact of the Labour Codes on gratuity and compensated absences, ₹1,388 crore of termination benefits for associates released under the reskilling and redeployment programme, and a US$112 million provision after the appeals court upheld the Computer Sciences Corporation verdict. Each of these is disclosed, with the amounts, in the MD&A on pages 88 and 89, and the consolidated statement of profit and loss on page 197 shows profit for the year of ₹49,454 crore against ₹48,797 crore, a 1.3% increase. The management narrative, including the Chairman's letter, reports net income of ₹52,820 crore, up 8.8%, and describes the net margin as the highest in four years.
The convention is legitimate and the exclusions are explained. The problem is placement and prominence. A reader should not need to know that a paragraph on page 5 changes the meaning of every number on pages 12 to 64, and the words "excluding exceptional items" should appear next to the headline figures, not only in a note. The termination benefits, in particular, are an outcome of the year's strategy, not a one-off unrelated to it; a Human+AI operating model that releases associates has a human-capital cost that the integrated report should show in the same place it shows the 69 million learning hours.
In practice: if you exclude exceptional items from management commentary, put a one-line reconciliation (reported profit, exceptional items, adjusted profit) on the highlights page and label every adjusted figure. Readers who find the reconciliation on page 197 will assume you hoped they wouldn't.
Design and readability: 4/5
The chapter system is consistent: a capital-coloured band, a large title, a one-paragraph purpose statement, "key outcomes" or a targets table, then charts with commentary. Page furniture shows the section (Corporate Overview, Statutory Reports, Financial Statements) at the top of every page, which helps in a 383-page document. Charts use one accent colour and grey for prior years, and label values directly.
The dense spreads are in the thematic section, where diagrams of the AI market opportunity and system-integrator history carry more labels than a reader can absorb. The customer-stories pages are well done and would have carried the thematic argument on their own.
Digital version: 4/5
The PDF is a single file with a working bookmark tree, a QR code to the online report on the contents page, and a feedback address. One production slip: the bookmark labels are the internal file names of the sections, including dates, version numbers and, for the shareholder-information section, the words "Draft 1". It is harmless, and it is the kind of thing a final pre-flight check catches. Like the Reliance report, the PDF is built as spreads, so single-page export would serve phone readers better.
What reporting teams can take from it
Copy the business-model spread: inputs, activities and outcomes by capital, with numbers in every box. Copy the goal-target-status layout for environmental disclosure, and show absolute tonnes next to the percentages. Put the BRSR inside the report and cross-reference it from the capitals. Add a tax strategy page.
Don't copy the way exceptional items are handled. Explain the adjustment where the adjusted numbers appear, reconcile to statutory profit on the highlights page, and treat the cost of workforce restructuring as part of the human-capital story rather than something outside it.
Series scorecard
Every report in this series is scored on the same seven-point card by the same reader. Scores are editorial opinion of the published document; each review carries the page references behind its findings.
| Company | Score (of 35) |
|---|---|
| Hindustan Zinc | 30 |
| TCS (this review) | 29 |
| HUL | 28 |
| Reliance | 27 |
| L&T | 27 |
| Bharti Airtel | 27 |
| HDFC Bank | 26 |
| ICICI Bank | 25 |
| Infosys | 25 |
| ITC | 21 |
Frequently asked questions
Does TCS's annual report include the BRSR?
Yes. Unlike Reliance, which publishes the BRSR separately, TCS places the full Business Responsibility and Sustainability Report inside the integrated annual report at pages 135 to 186, followed by a GRI content index and KPMG's assurance report. The IFRS S2 climate report is a separate document linked from the MD&A.
What are TCS's climate targets and how far along is it?
Near-term SBTi targets are a 90% cut in absolute Scope 1 and 2 emissions by FY 2030 from an FY 2016 base, and a 35% cut in absolute Scope 3 by FY 2034 from FY 2020. At FY 2026 the report shows 84% and 26% achieved respectively. Scope 1+2 fell from 471,000 to 76,900 tonnes CO2e; Scope 3 value-chain emissions from 772,000 to 574,000 tonnes.
Why does TCS's reported profit growth differ from the statutory accounts?
The 'About the Report' page states that all figures in non-statutory sections exclude exceptional items: ₹2,128 crore for the Labour Codes, ₹1,388 crore of termination benefits from the reskilling and redeployment programme, and a US$112 million provision for the Computer Sciences Corporation lawsuit. The management sections show net income of ₹52,820 crore, up 8.8%; the consolidated statement of profit and loss shows ₹49,454 crore, up 1.3%.
Who assures TCS's sustainability disclosures?
KPMG Assurance and Consulting Services LLP issued a reasonable assurance report on BRSR Core attributes dated 15 May 2026 and a limited assurance report on selected other BRSR attributes and GRI indicators. B S R & Co. LLP audits the financial statements.
What does TCS's integrated business model show?
A single spread that lists inputs for each of five capitals (for example ₹107,240 crore of equity, 584,519 employees, ₹2,900 crore of research spend), five value-creation activities, and outputs and outcomes per capital (25.0% operating margin, 51.4% return on equity, 66 clients above US$100 million, 84% reduction in Scope 1+2). It is the format the <IR> Framework describes and few Indian reports execute.
How does The Footnotes score annual reports?
Seven criteria, each scored 1 to 5 with a one-line reason: strategy and narrative; integrated thinking and capitals; BRSR and ESG integration; governance disclosure; financial storytelling; design and readability; and the digital version. Scores are editorial opinion based on the published document, and the same card is used for every company so results can be compared.
Sources
- Tata Consultancy Services — Integrated Annual Report 2025-26 (PDF) — Tata Consultancy Services
- TCS Investor Relations — Tata Consultancy Services
- Integrated Reporting Framework (IFRS Foundation) — IFRS Foundation
- SEBI circular: BRSR Core — framework for assurance and ESG disclosures for value chain (12 July 2023) — SEBI