

Reliance Industries Integrated Annual Report 2025-26: A Review
Our review of Reliance's report against the <IR> Framework, BRSR expectations and plain readability. Reliance's 2025-26 report is disciplined and well-assured, but its materiality work is three years old and Scope 3 is missing from the integrated report.
 In short
Key takeaways
- Reliance's FY 2025-26 Integrated Annual Report runs to roughly 290 printed pages, with the integrated narrative, ESG capitals and governance report in the first 100 and financial statements from page 100; BRSR and the CSR report are published as separate documents in a 'reporting suite'.
- The report maps each enterprise risk to the capitals it affects (F, M, H, S, N, I icons), tags each capital chapter to BRSR principles and UN SDGs, and lists 25 material topics with page references, which is stronger cross-referencing than most Nifty 50 reports.
- Sustainability information is subject to reasonable assurance (Appendix I) and limited assurance (Appendix II) by Deloitte Haskins & Sells LLP, a higher bar than the limited-assurance-only norm.
- The materiality section claims a double-materiality lens but refers readers to page 164 of the 2022-23 report for method and prioritisation, so the assessment is at least three reporting cycles old.
- Scope 1 and 2 emissions are disclosed at 45.52 million tonnes CO2e (market-based; 46.13 location-based), but the integrated report contains no Scope 3 figure and no interim emissions-reduction trajectory between now and the Net Carbon Zero 2035 target.
- The Chairman's statement flags a first: RIL crossing US$10 billion in annual net profit (PAT ₹95,754 crore), and signals 'strategic pathways that can broaden stakeholder participation' in Jio, which reads as groundwork for a listing.
Reliance Industries publishes India's most-read annual report, if only because it is the largest company in the country by market value and the first to cross US$10 billion in annual net profit. Its Integrated Annual Report 2025-26 is reviewed here the way every report in our annual-report series is: against the same seven-point card, with page references, and with a view to what a reporting team can learn from it.
A note on method before the verdict. We reviewed the published PDF of the integrated annual report (147 spreads, about 290 printed pages) as an ordinary reader and practitioner would: cover to financials, with the <IR> Framework, SEBI's BRSR Core expectations and plain readability as the yardsticks. Scores are our opinion. Screenshots are reproduced in small excerpts for the purpose of review and are the copyright of Reliance Industries Limited; the full report is on the company's investor relations pages.
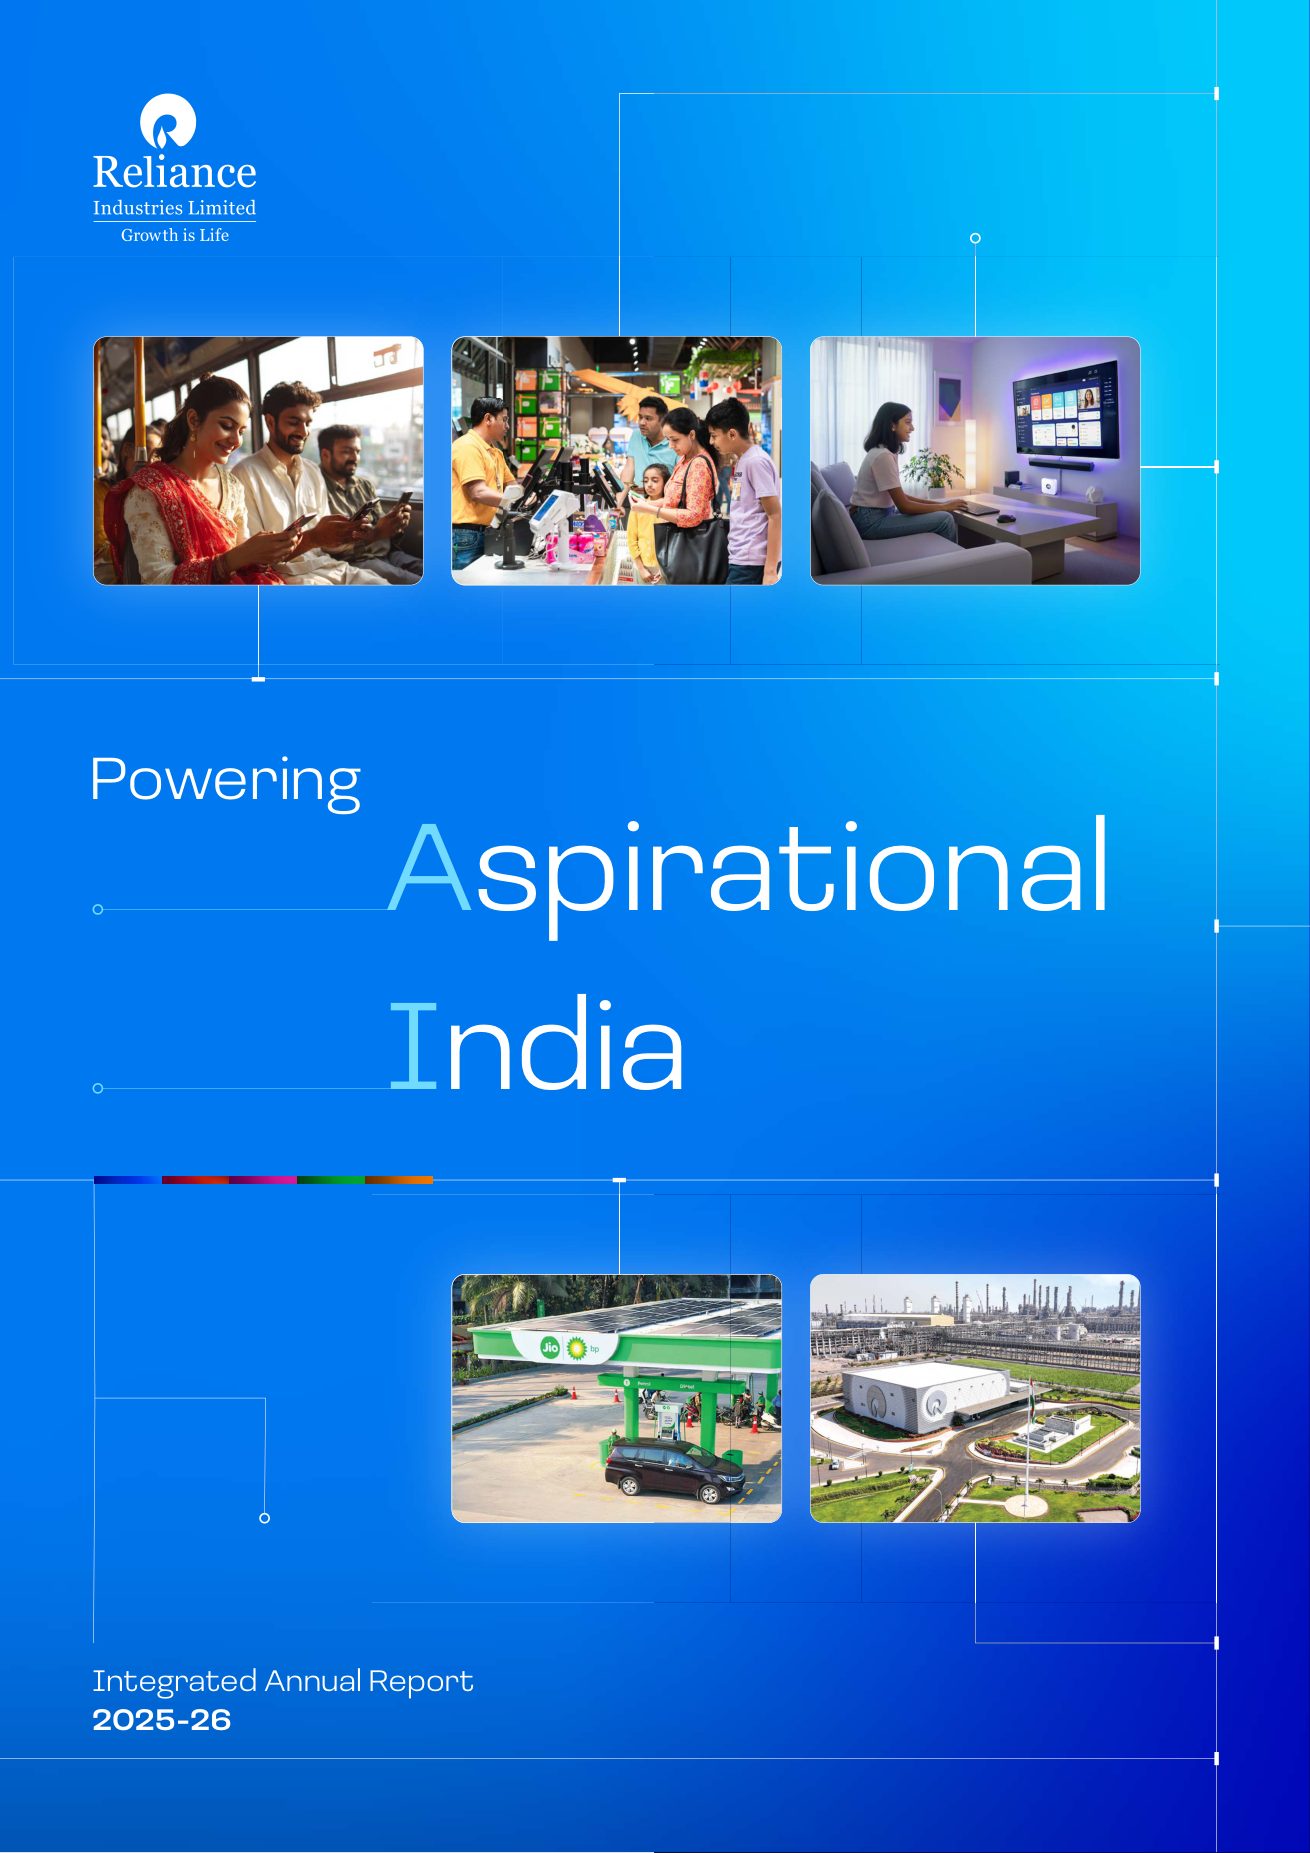
The scorecard
| Criterion | Score (of 5) | In one line |
|---|---|---|
| Strategy and narrative | 4 | Clear "growth engines" framing and a Chairman's letter that says something; thin on trade-offs |
| Integrated thinking and the capitals | 4 | Risks mapped to capitals and capitals mapped to BRSR/SDGs, but no inputs-to-outcomes business model diagram |
| BRSR and ESG integration | 3 | Strong cross-referencing, reasonable assurance; materiality dated, Scope 3 absent |
| Governance disclosure | 4 | Full attendance, remuneration and committee tables; family relationships stated plainly |
| Financial storytelling | 4 | Value-added statement and segment tiles do the work; ten-year table is genuinely useful |
| Design and readability | 4 | Colour-coded segments and consistent page furniture; awards run to two spreads |
| Digital version | 4 | Online integrated report with in-page navigation; the PDF is built as spreads, which hurts on phones |
| Total | 27 / 35 |
What the report is, and what it isn't
Reliance has taken the "reporting suite" route. The integrated annual report carries the narrative, the six-capitals chapters, the corporate governance report, the Board's report and the financial statements. The Business Responsibility and Sustainability Report and a separate CSR report sit alongside it as their own documents, and the front matter says so on the second page.
That choice keeps the integrated report to roughly 100 printed pages before the financials start, which is a relief in a market where 400-page reports are normal. The cost is that a reader looking for BRSR Core metrics inside the integrated report finds signposts rather than numbers. Each capital chapter carries a small tag listing the BRSR principles it addresses (P2 and P6 for natural capital, for instance) and the relevant UN SDGs. That is good practice and more than most Nifty 50 reports offer, but it is a pointer, not the disclosure.
Key number: 290 — approximate printed pages in the integrated report, of which the narrative, capitals and governance take the first 100 and the financial statements the rest.
Strategy and narrative: 4/5
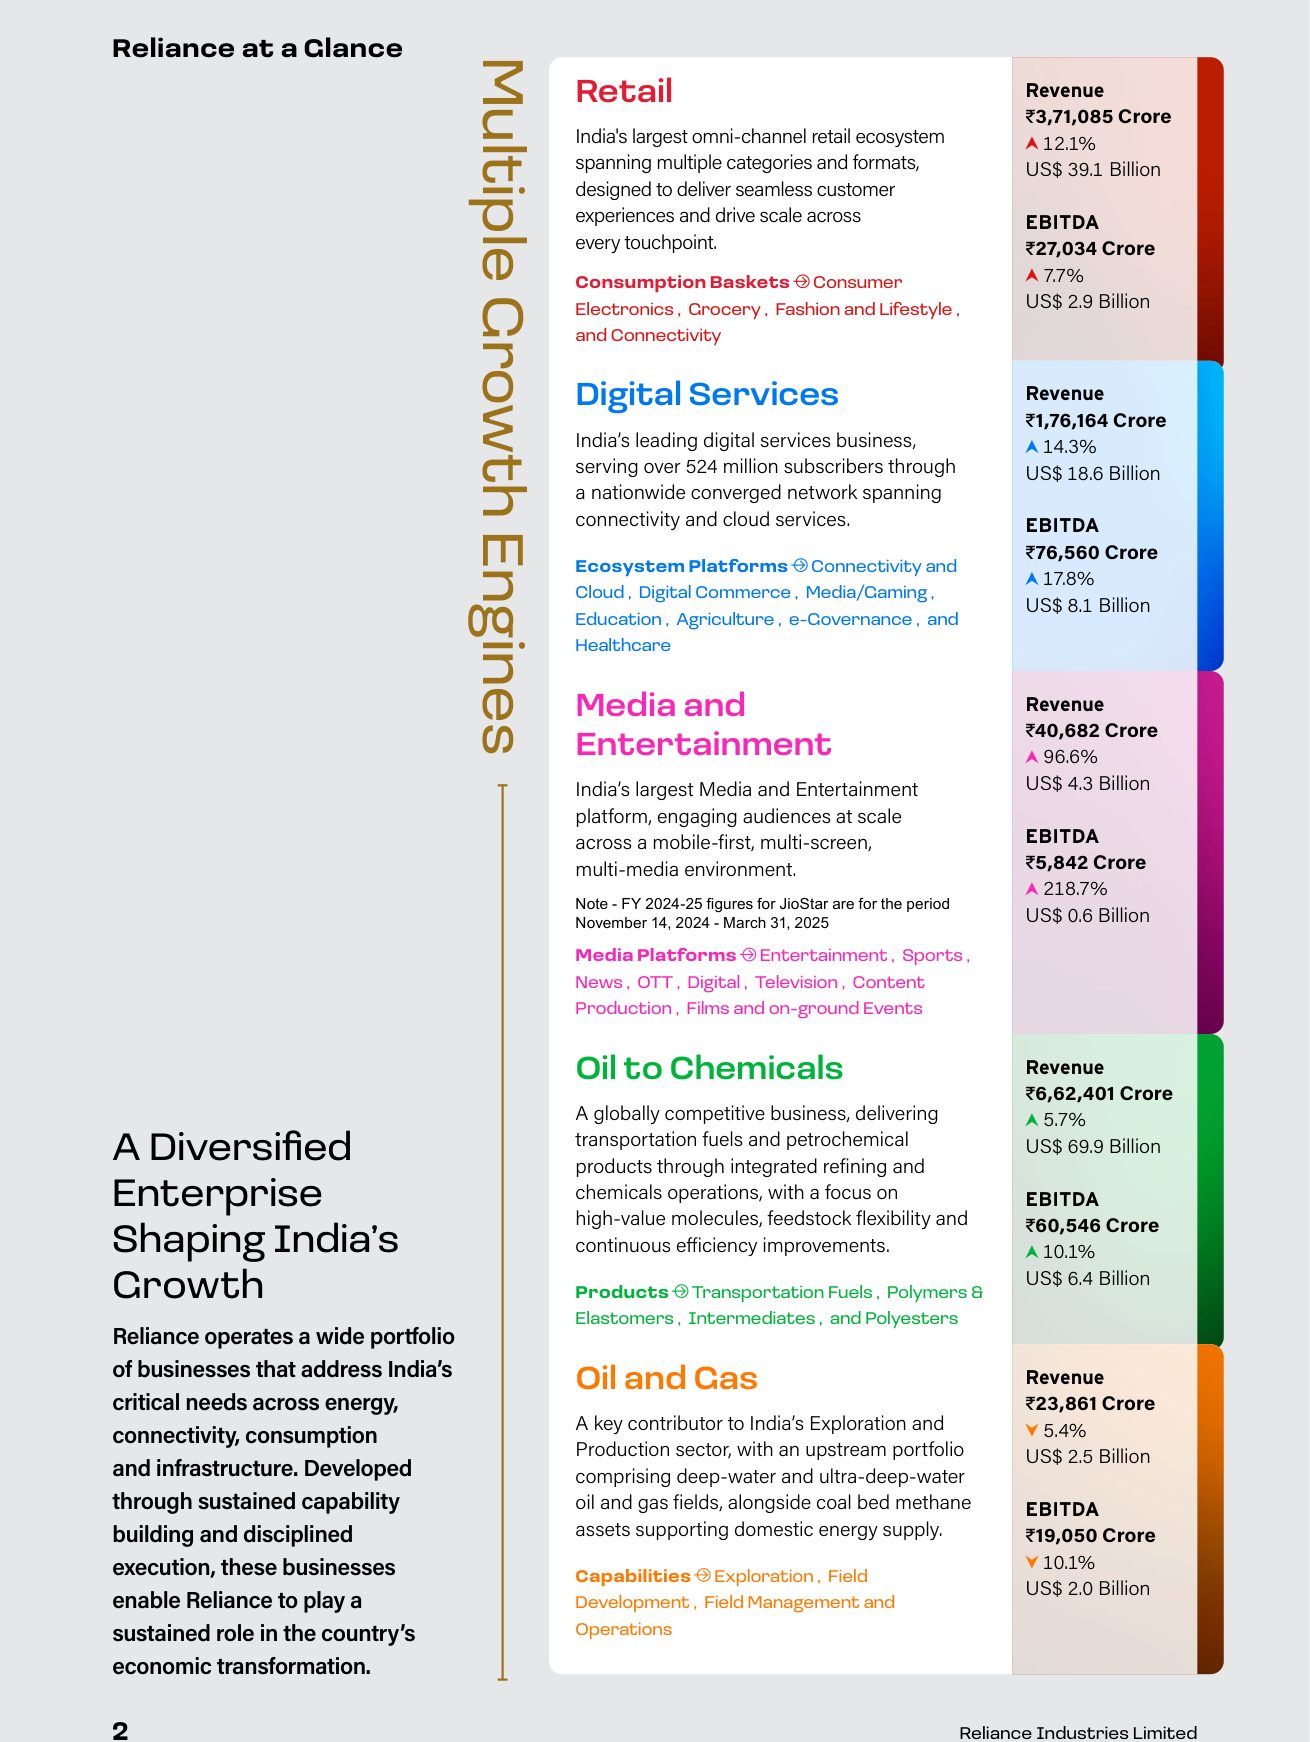
The "Reliance at a Glance" spread is the report's best single page. Five growth engines run down a colour-coded column, each with a two-line description, its consumption baskets or products, and revenue and EBITDA with year-on-year change in rupees and dollars. A reader who opens the report knowing nothing about Reliance leaves that page knowing the shape of the group and where the growth came from.
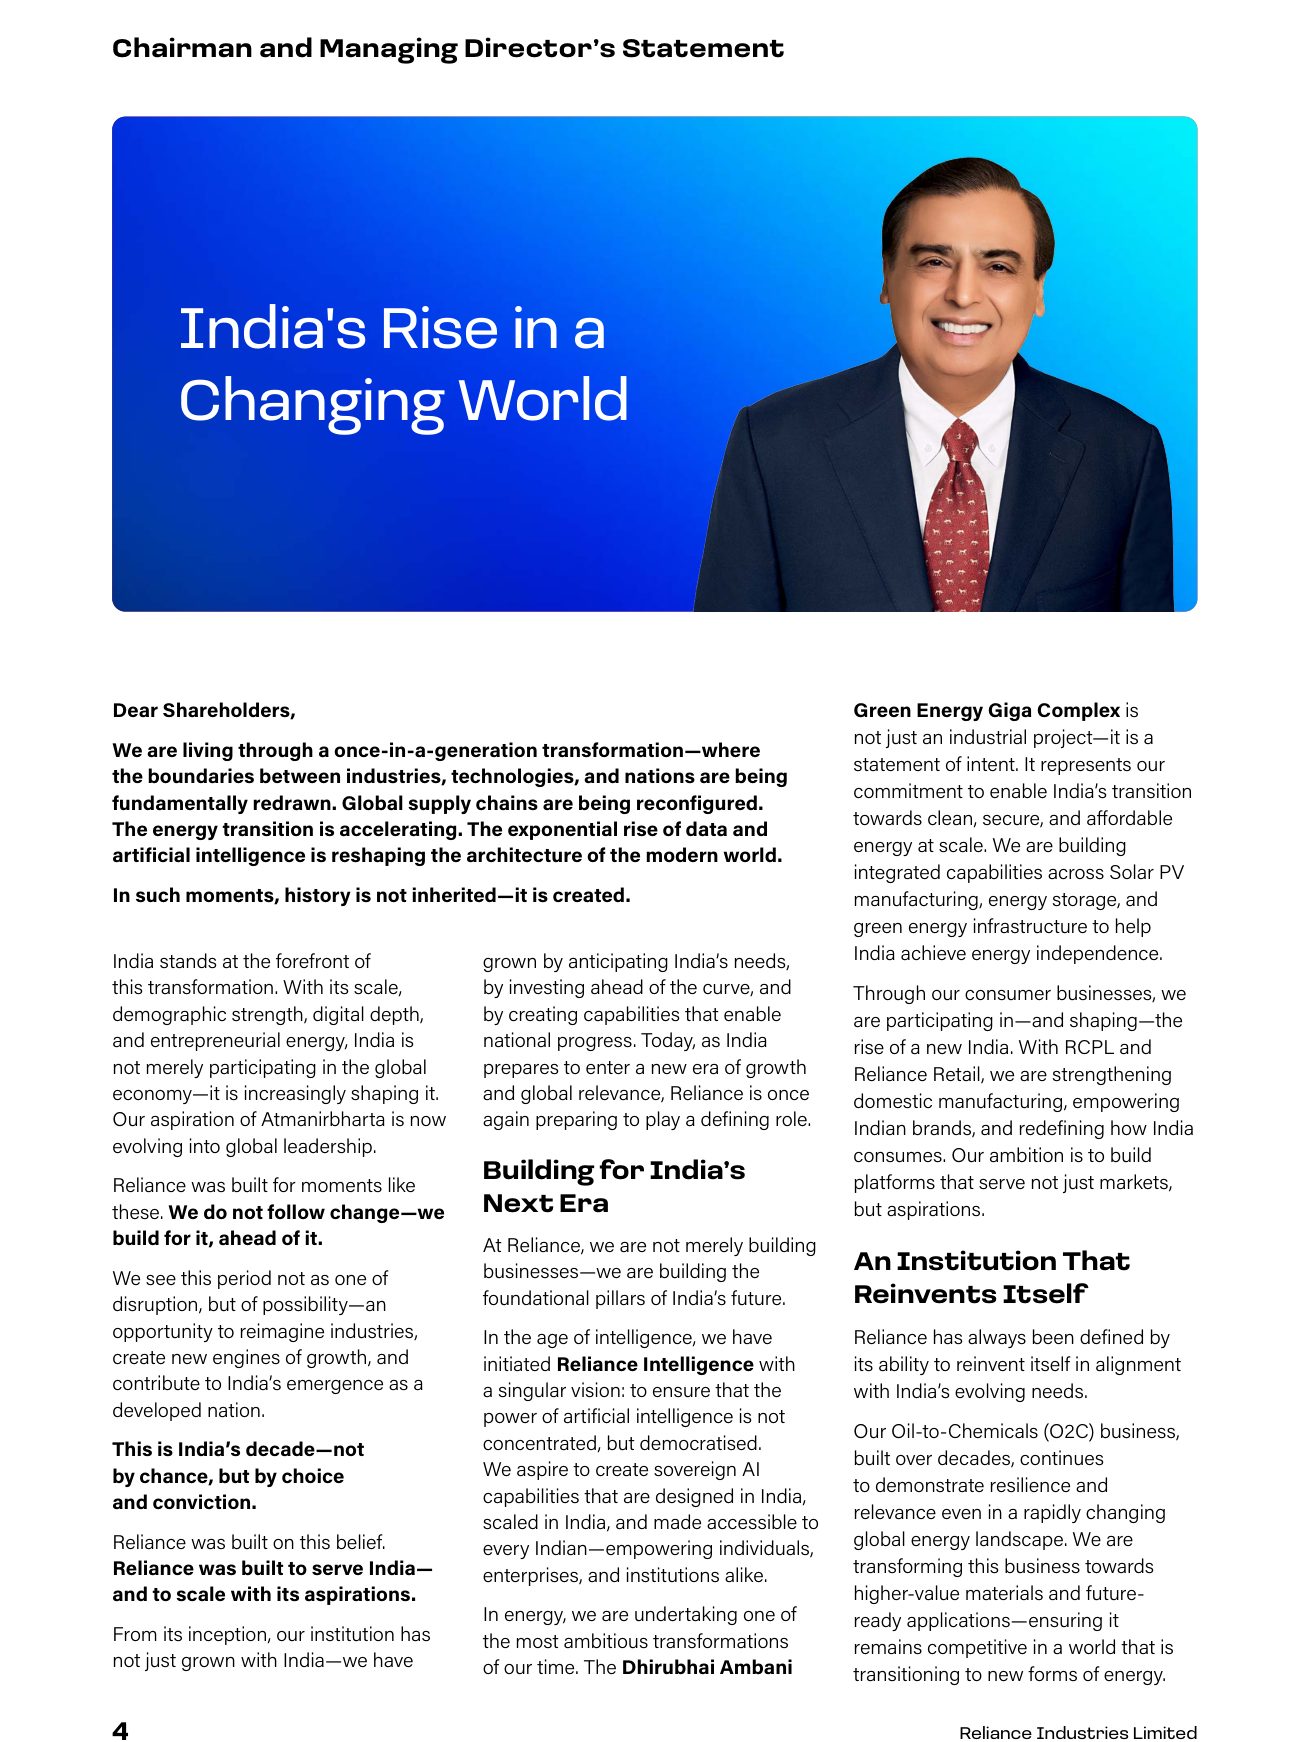
The Chairman and Managing Director's statement is a single spread, which is the right length. It also contains actual news: the US$10 billion profit milestone, the launch of "Reliance Intelligence" for sovereign AI, the state of the Jamnagar giga-complex, and a carefully worded line that the company "will continue to evaluate strategic pathways that can broaden stakeholder participation and support Jio's long-term growth". Anyone who follows the group will read that as preparation for a Jio listing, and it's notable that the annual report is where the signal was placed.
Where the narrative is weaker is on trade-offs. The letter and the MD&A describe a group investing ₹1,44,271 crore of capex in a year while carrying ₹3,74,421 crore of gross debt, funding both a hydrocarbon business and a new-energy build-out. The report explains each; it doesn't explain how capital is allocated between them, or what would cause that allocation to change. That is the question an integrated report exists to answer.
Integrated thinking and the capitals: 4/5
Two pieces of connective tissue lift this report above the pack.
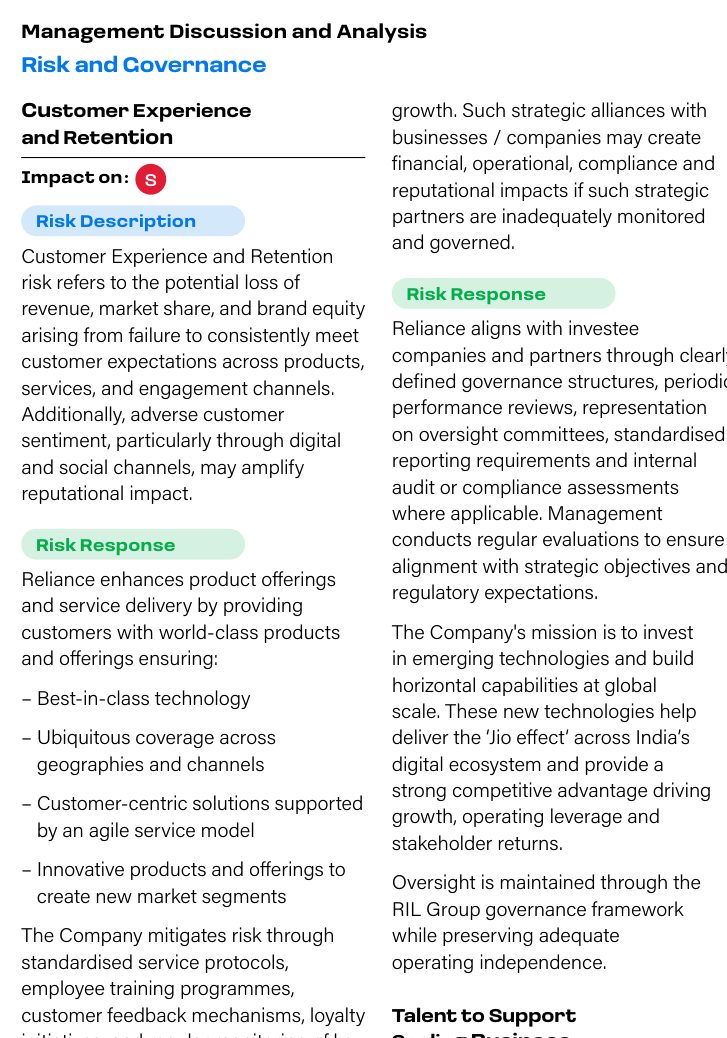
The first is the risk section. Every enterprise risk carries an "Impact on" line with small coloured icons for the capitals it affects: F, M, H, S, N and I. Cybersecurity hits intellectual capital; HSE hits human, manufactured and natural; oversight of investee companies hits financial and manufactured. It is a simple device, and it forces the risk owner to say which part of the value-creation story is at stake.
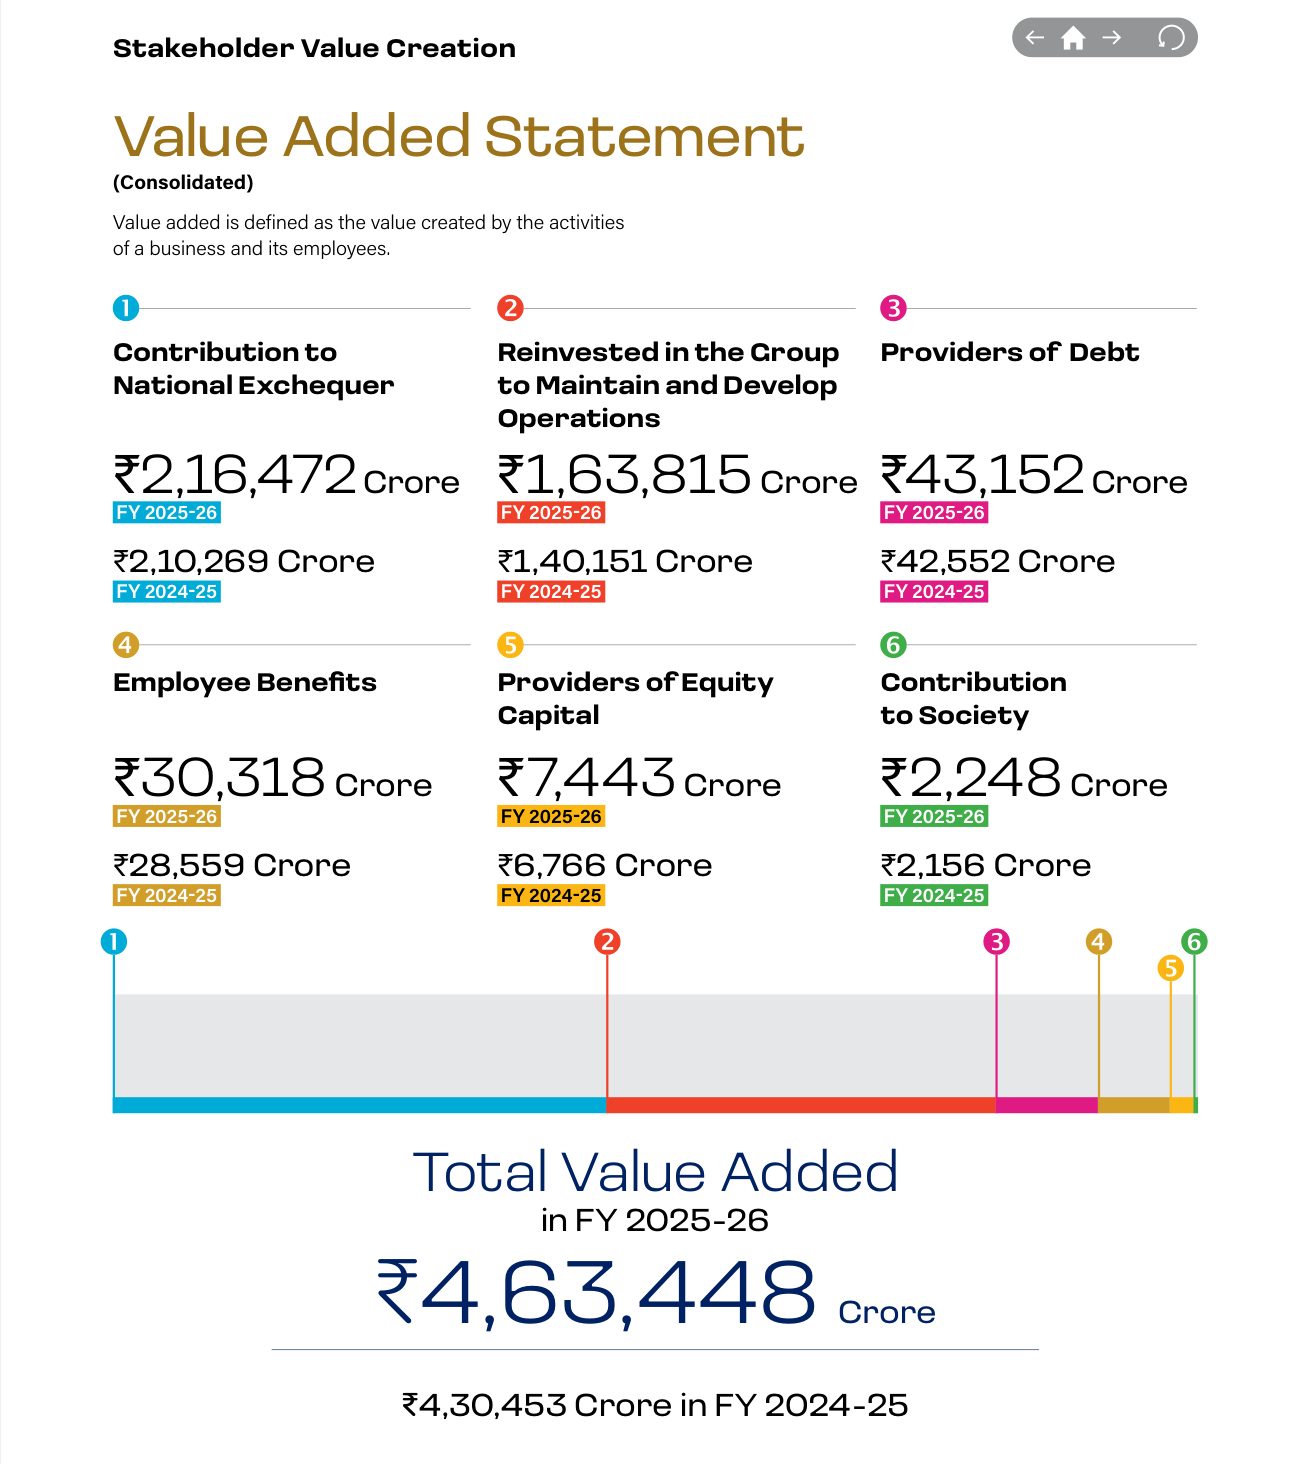
The second is the Value Added Statement on page 3, which shows where ₹4,63,448 crore of value added went: ₹2,16,472 crore to the national exchequer, ₹1,63,815 crore reinvested, ₹43,152 crore to providers of debt, ₹30,318 crore to employees, ₹7,443 crore to equity holders and ₹2,248 crore to society, each against the prior year. This is stakeholder reporting in numbers rather than adjectives, and few Indian companies publish it.
What is missing is the <IR> Framework's centrepiece: a business model that shows inputs by capital, business activities, outputs and outcomes on one page. The "Integrated Approach to Sustainable Growth" chapter names the six capitals and links to the financial chapter, but the reader has to assemble the model from the separate capital sections. For a company whose whole story is the conversion of hydrocarbon cash into digital, retail and clean-energy assets, that diagram would be the most useful page in the report.
In practice: if your report already maps risks to capitals, the business-model diagram is one working session away. Take the same capital icons, list the year's inputs and outputs under each, and connect them to the strategy pillars. Reliance has all the components; they are not yet on one page.
BRSR and ESG integration: 3/5
This is where the report is strongest on process and weakest on currency.
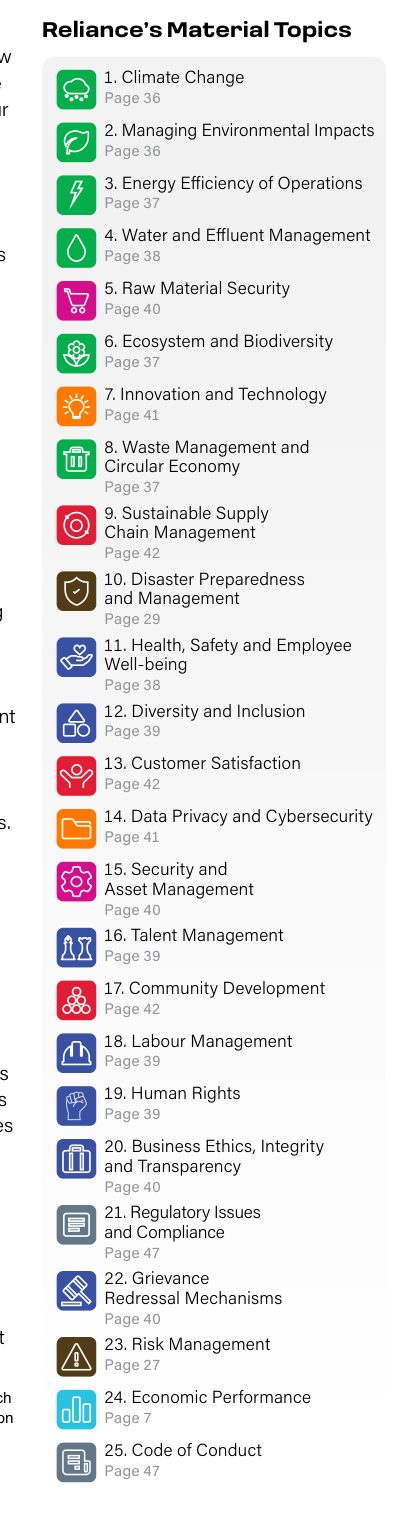
On process: the sustainability governance structure is drawn out (Board, ESG Committee of one independent and two executive directors, Executive Management Team, business areas), the report lists 25 material topics with the page where each is addressed, and the climate chapter follows the four TCFD pillars, which the report notes are now integrated within IFRS S2. Deloitte Haskins & Sells LLP provides reasonable assurance on the sustainability information in Appendix I and limited assurance on Appendix II. Reasonable assurance on any non-financial metrics remains uncommon among Indian issuers and deserves credit.
On currency, three problems.
The materiality section says the assessment "was carried out using a double materiality lens" and then adds: "More details about the double materiality approach and prioritisation of material topics can be found on Pg 164 of the Integrated Annual Report 2022-23." Referencing a three-year-old method is legitimate if nothing has changed; it also means a reader of the 2025-26 report cannot see who was consulted, how topics were weighted or what moved. Given that the group has since added a media business, an AI business and a giga-scale manufacturing complex, "nothing has changed" is hard to accept.
Second, the integrated report contains no Scope 3 figure. Scope 1 and 2 are disclosed at 45.52 million tonnes CO2e (market-based; 46.13 million tonnes location-based), and methane intensity for upstream at around 0.0019%. For a refiner and petrochemicals producer, Scope 3 category 11 (use of sold products) will dwarf that number, and its absence from the headline document is a gap that IFRS S2-aligned reporting will not allow for long.
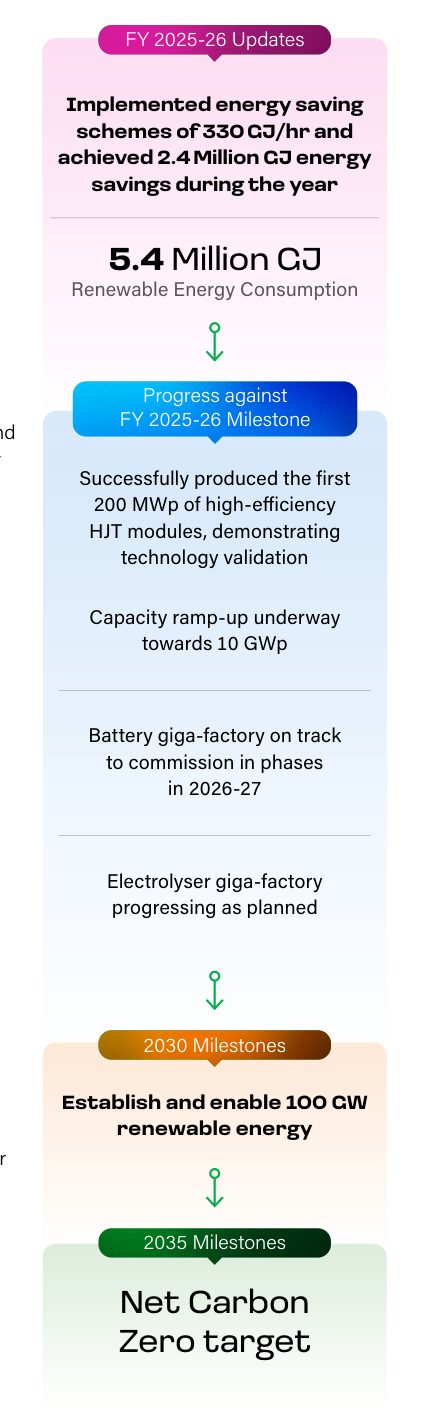
Third, the Net Carbon Zero 2035 pathway is described as milestones (HJT modules, giga-factories, 100 GW enabled by 2030) rather than as an emissions trajectory. There is no interim reduction target, and no chart of where 45.52 million tonnes needs to be in 2028 or 2031.
Human capital disclosure is sound on safety (LTIFR of 0.06 per million man-hours; a workforce of 4,19,911) and gives women's representation in leadership at 14.7%, but the diversity narrative is programme-led rather than target-led.
Governance disclosure: 4/5
The corporate governance report does what SEBI LODR Schedule V asks and does it legibly. Each director gets appointment date, shareholding, other directorships with category, committee positions and areas of expertise. The board met five times against a statutory four; the audit committee met twelve times. Attendance is shown per meeting with percentages. Executive remuneration is tabulated (the Chairman draws nil; the two Meswanis ₹25 crore each; P.M.S. Prasad ₹20.58 crore; Anant Ambani ₹12.17 crore from May 2025), as is commission to non-executives at ₹2.50 crore each.
The report also states the family relationships on the board without euphemism: Mukesh Ambani is the father of the three promoter directors; the Meswanis are brothers. Plain statements of this kind are what governance disclosure should look like.
What we'd want next year is a page on board evaluation outcomes rather than criteria, and a skills matrix as a grid rather than a repeated bullet list under each director.
Financial storytelling: 4/5
The MD&A opens with operating environment, then performance, then segment by segment, with net debt (₹1,24,717 crore), capex and standalone numbers each given their own paragraph. The ten-year consolidated highlights table covers FY 2016-17 to FY 2025-26 with a US$ column, which is the kind of thing analysts photograph and file. Segment tiles on the "at a glance" spread show revenue and EBITDA growth side by side, and the media segment's 218.7% EBITDA growth is footnoted as a partial-year base, which is honest.
Two things would improve it: a short bridge from EBITDA to cash profit to capex to net debt, in one chart, and a line or two on return on capital by segment, which the report leaves to the reader.
Design and readability: 4/5
The design system is consistent: one colour per growth engine, carried from the cover strip through the segment tiles into the capital chapters; a fixed three-column grid for narrative pages; small "Read on PG" cross-references in coloured pills. Type is set at a size that survives printing. The awards section runs to two full spreads, which is two spreads of trophies where a reader would rather have the business-model diagram.
The PDF is exported as two-page spreads (each PDF page holds two printed pages). That looks right on a desktop and badly on a phone, where every page needs a pinch-zoom. Companies that expect mobile readers should export single pages.
Digital version: 4/5
The report front matter links to an online integrated annual report, and the PDF's page furniture carries navigation icons (home, back, forward, search), which suggests it was built for on-screen use. We assessed the PDF; the online version is where the spread problem is solved, and the presence of a proper digital edition is why the score is a 4 rather than a 3.
What reporting teams can take from it
Borrow the risk-to-capital icons; they cost nothing and change how risk owners write. Borrow the value-added statement; it converts "stakeholder value" from a slogan into a table. Borrow the BRSR-principle tags on each chapter if you publish the BRSR separately.
Don't borrow the deferred materiality reference. If the assessment is old, say when it was done and when it will be refreshed. And if you are an emitter of any size, put Scope 3 in the integrated report, even as an estimate with stated boundaries, before a standard makes you.
Series scorecard
Every report in this series is scored on the same seven-point card by the same reader. Scores are editorial opinion of the published document; each review carries the page references behind its findings.
| Company | Score (of 35) |
|---|---|
| Hindustan Zinc | 30 |
| TCS | 29 |
| HUL | 28 |
| Reliance (this review) | 27 |
| L&T | 27 |
| Bharti Airtel | 27 |
| HDFC Bank | 26 |
| ICICI Bank | 25 |
| Infosys | 25 |
| ITC | 21 |
Frequently asked questions
Is Reliance's annual report an integrated report under the <IR> Framework?
Yes. The report states it is prepared in alignment with the Integrated Reporting <IR> Framework, now under the IFRS Foundation, and organises its sustainability chapters by the six capitals: financial, manufactured, intellectual, human, social and relationship, and natural. It also references GRI, NGRBC, UN SDGs, UNGC, UNGP, the GHG Protocol and IPIECA.
Does Reliance's 2025-26 report include the BRSR?
Not inside the integrated report. RIL publishes the Business Responsibility and Sustainability Report as a separate document in its 'reporting suite' alongside the online integrated report and a CSR report. Each capital chapter in the integrated report is tagged to the BRSR principles it addresses, so readers can cross-refer.
Who provides assurance on Reliance's sustainability disclosures?
Deloitte Haskins & Sells LLP issued an Independent Practitioner's Assurance Report on identified sustainability information, giving reasonable assurance on the metrics listed in Appendix I and limited assurance on those in Appendix II. Reasonable assurance on any non-financial metrics is still uncommon among Indian issuers.
What is Reliance's net zero target and what progress does the report show?
The target is Net Carbon Zero by 2035, with 100 GW of renewable capacity enabled by 2030. FY 2025-26 milestones reported include the first 200 MWp of HJT solar modules produced at Jamnagar, 5.4 million GJ of renewable energy consumed, 2.4 million GJ of energy savings, and battery and electrolyser giga-factories on track for phased commissioning from 2026-27.
What does the report not disclose that a reader might expect?
Scope 3 emissions are not reported in the integrated report; the materiality methodology is only referenced back to the 2022-23 report; and there is no year-by-year emissions pathway to the 2035 target. Readers must consult the separate BRSR for several BRSR Core metrics.
How does The Footnotes score annual reports?
Seven criteria, each scored 1 to 5 with a one-line reason: strategy and narrative; integrated thinking and capitals; BRSR and ESG integration; governance disclosure; financial storytelling; design and readability; and the digital version. Scores are editorial opinion, based on the published document, and the same card is used for every company in the series so the results can be compared.
Sources
- Reliance Industries Limited — Integrated Annual Report 2025-26 (PDF) — Reliance Industries Limited
- Reliance Industries — Investors: reports and filings — Reliance Industries Limited
- Integrated Reporting Framework (IFRS Foundation) — IFRS Foundation
- SEBI circular: BRSR Core — framework for assurance and ESG disclosures for value chain (12 July 2023) — SEBI