

Hindustan Unilever Integrated Annual Report 2025-26: A Review
HUL's report contains the only page in this series that maps every capital to every other capital, an eleven-year track record with ratios, and a new CEO's first letter that gives the year's numbers in its second paragraph. Its weakest pages are its greenest: '99% reduction in Scope 1 and 2' is an intensity figure against a 2008 base, Scope 2 is reported as 'Net: 0' after IRECs, and the double materiality matrix has the axes of a single one.
 In short
Key takeaways
- The integrated section runs about 80 printed pages (corporate, performance, governance, sustainability and stakeholder overviews) ahead of the Board's report and MD&A, BRSR at page 128, governance report, financial statements and AGM notice; the 'About the Report' page names the IFRS Foundation's <IR> Framework and SEBI's integrated reporting guidance, and B S R & Co. LLP as BRSR assurance provider (reasonable on Core, limited on other indicators).
- 'Interplay of Capitals' (pages 12-13) is a full grid: for each of the six capitals, five short statements on how it feeds each of the other five, with examples such as the 45 MW off-site solar park (financial to manufactured) and the Minimalist and OZiva acquisitions (financial to intellectual); no other report in the series does this.
- Financial highlights: turnover ₹63,763 crore (up 5%, 4% underlying volume growth), EBITDA margin 23.6%, PAT from continuing operations ₹10,652 crore, EPS ₹45.25, standalone ROCE 110.9%, a ₹22 final dividend; the eleven-year table gives balance sheet lines and ratios back to 2015-16 and states that FY 2025-26 is on a continuing-operations basis after the ice-cream demerger, so ratios are 'not strictly comparable'.
- The new CEO and Managing Director, Priya Nair, writes her first shareholder letter and gives turnover, volume growth, quarterly acceleration (3% to 5% to 7% underlying sales growth), margin, PAT and dividend by the second paragraph; the Chairman's statement records the succession from Rohit Jawa.
- Environmental headlines are intensity figures against a 2008 baseline ('99% reduction in Scope 1 and 2 emissions in operations, kg per tonne'); in the BRSR, Scope 1 is 7,054 tCO2e and Scope 2 is 'Gross: 2,31,262, Net: 0' after International Renewable Energy Certificates, while Scope 3 within the net-zero boundary is 1.05 crore tonnes, up 5.8%.
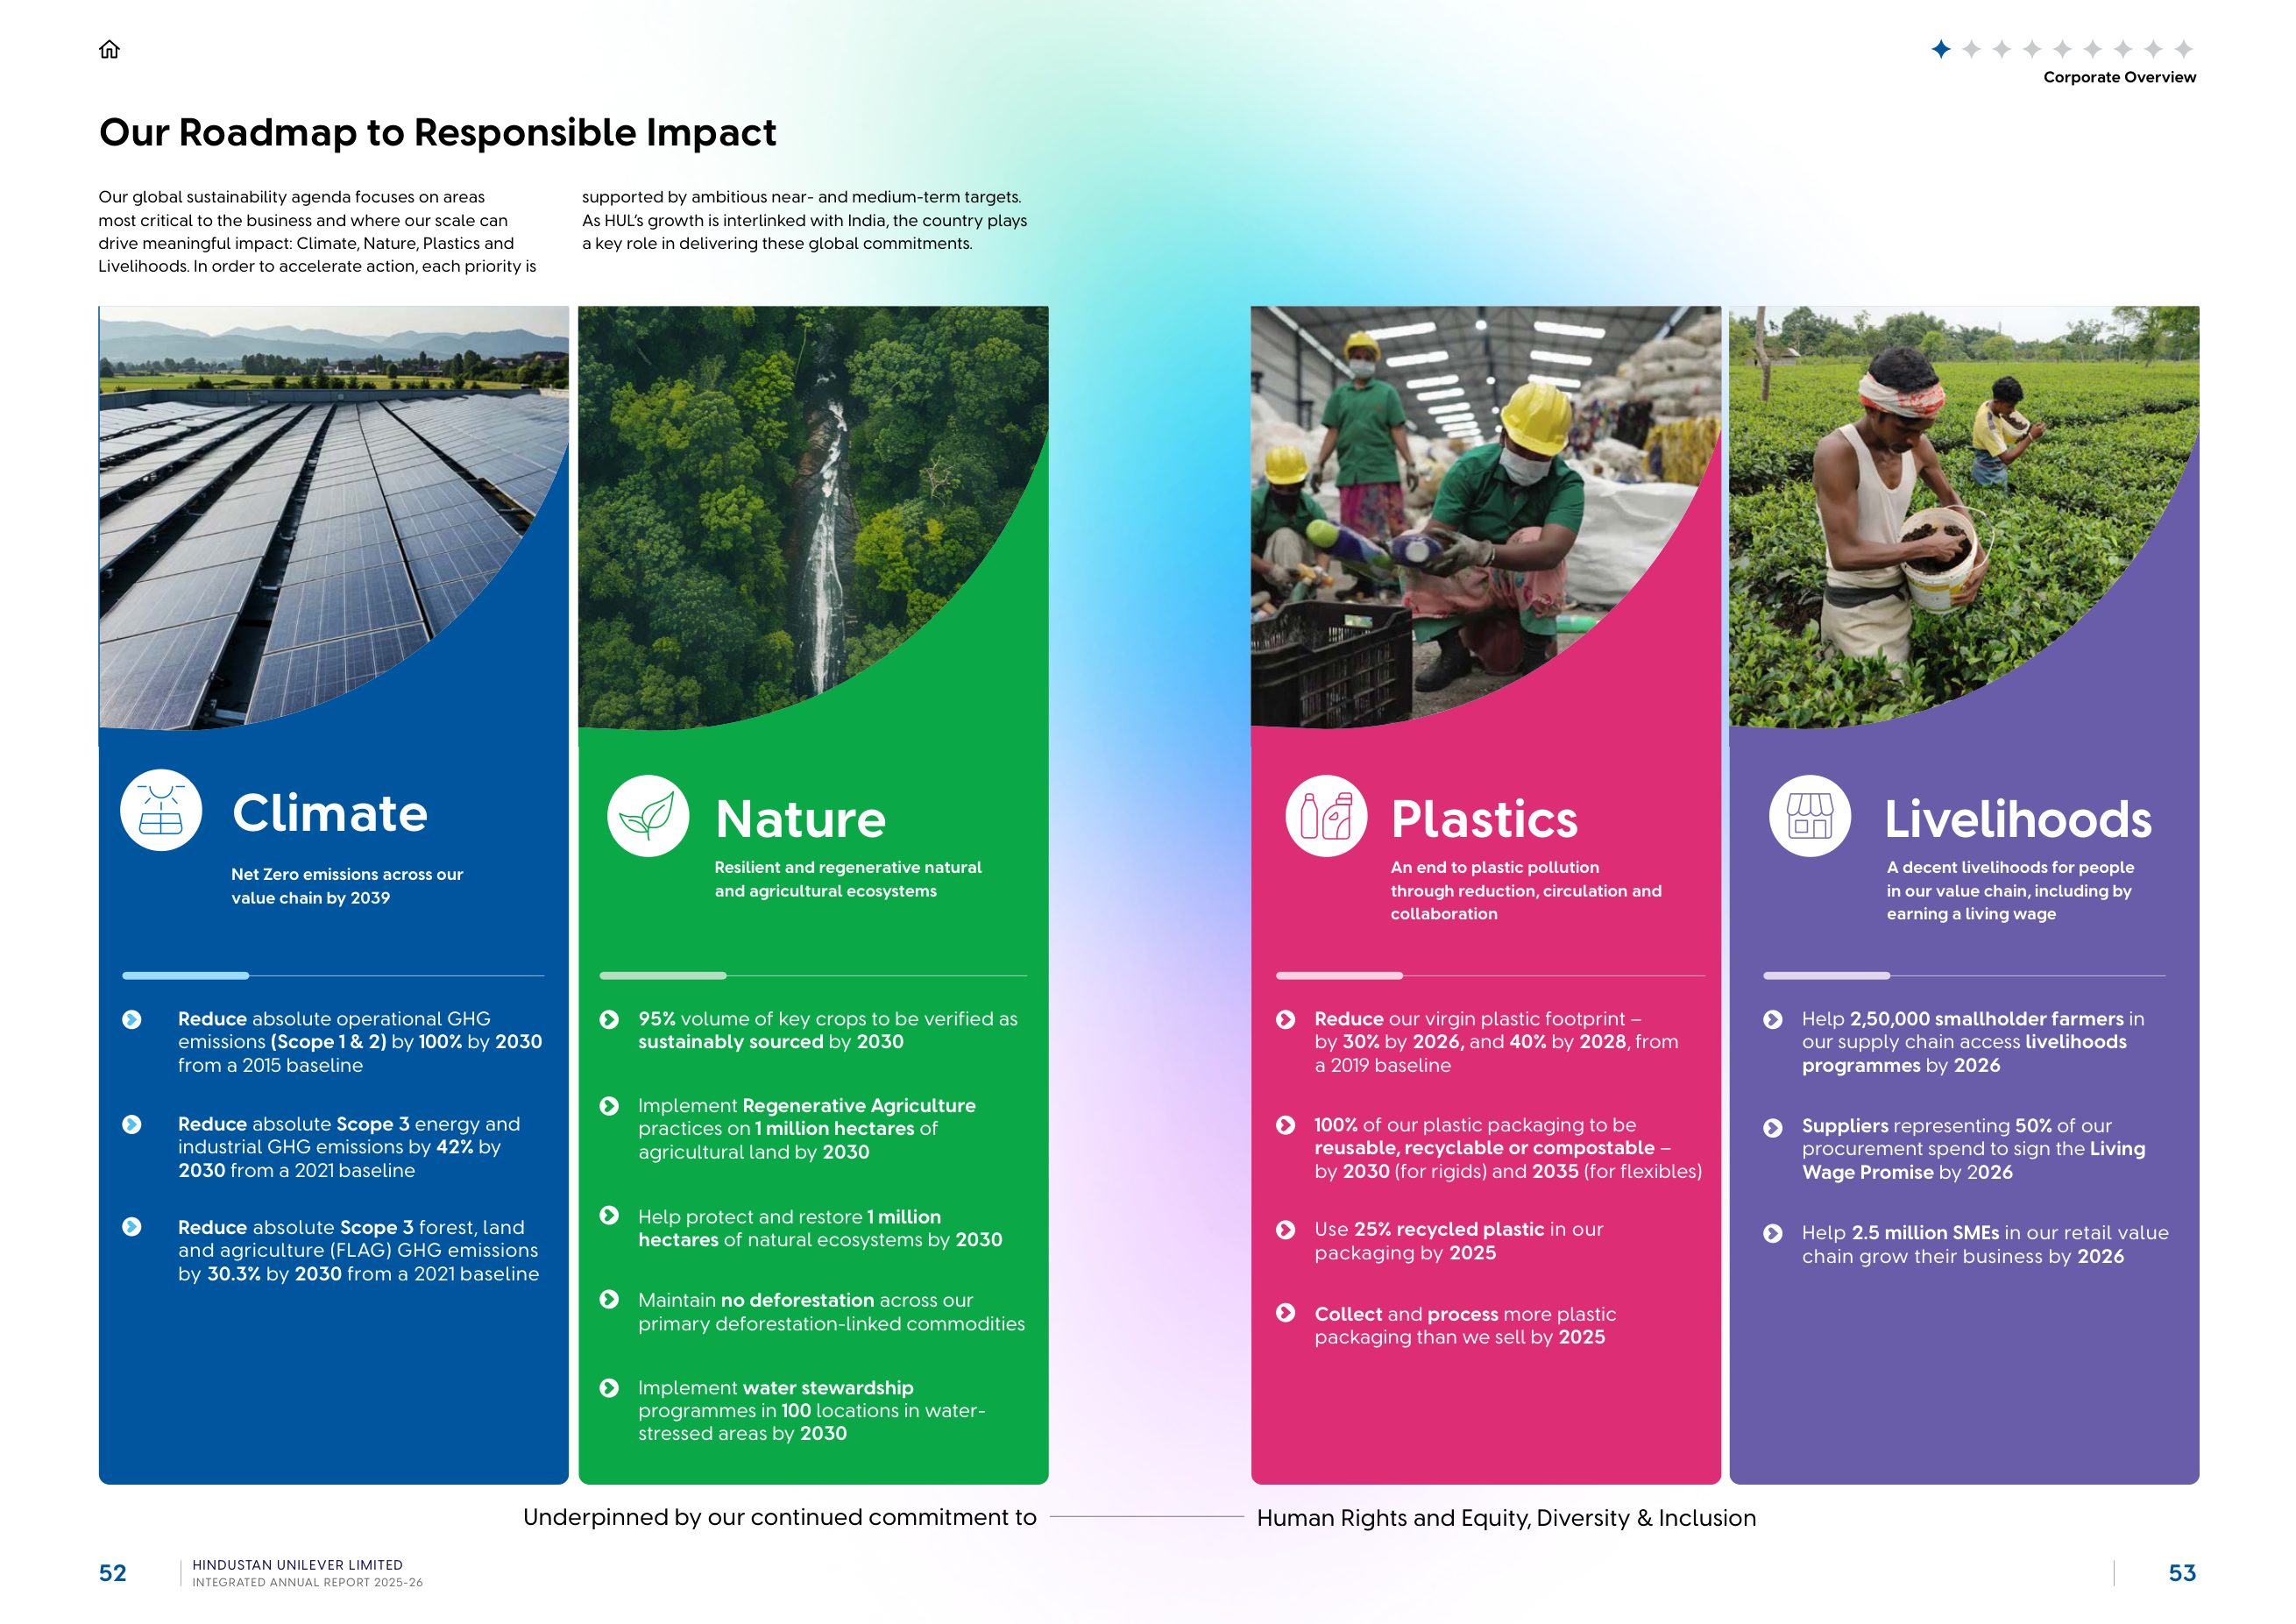
- Targets are Unilever's: absolute Scope 1 and 2 down 100% by 2030 from 2015, Scope 3 FLAG down 30.3% and energy-and-industrial down 42% by 2030 from 2021, net zero across the value chain by 2039; the 'Double Materiality' matrix plots 'Importance to Stakeholders' against 'Impact to Business', which are single-materiality axes, and refers readers to the website for the assessment.
Hindustan Unilever has been making the case that a consumer company can be run as an integrated one for longer than most, and its FY 2025-26 report has a page that proves the point better than any value creation model in this series. It also has environmental pages that a reader must handle with care, in a year when the company changed its CEO and demerged its ice-cream business.
As with every review in this series, we read the published PDF against the <IR> Framework, SEBI's BRSR Core expectations and plain readability, and score it on the same seven-point card. Scores are our opinion. Screenshots are small excerpts reproduced for review and remain the copyright of Hindustan Unilever Limited; the full report is on the company's investor pages.

The scorecard
| Criterion | Score (of 5) | In one line |
|---|---|---|
| Strategy and narrative | 4 | Strategic priorities stated once and used; a Chairman's statement on succession and a new CEO's letter with the numbers up front |
| Integrated thinking and the capitals | 5 | A value creation model with outcomes per capital and a six-by-five interplay grid; the stakeholder chapters keep the connections going |
| BRSR and ESG integration | 3 | Unilever's targets are clear and the BRSR is complete with reasonable assurance; the headlines are intensity-based, Scope 2 is netted to zero, and the materiality page is thin |
| Governance disclosure | 4 | Governance philosophy, structure, highlights and integrity pages; the CEO succession is disclosed plainly |
| Financial storytelling | 5 | Eleven-year track record with balance sheet and ratios, continuing-operations basis stated, EVA, segment revenue and EBIT |
| Design and readability | 4 | Compact integrated section, one visual system, good use of icons; featured stories interrupt |
| Digital version | 3 | Bookmarked spreads and a home icon on every page; materiality and much ESG detail are on the website |
| Total | 28 / 35 |
What the report is
An integrated section of about 80 printed pages (about the report, corporate overview, performance overview, governance overview, sustainability, and a stakeholder engagement section organised by consumers, customers, suppliers, people, planet and society, and shareholders), followed by the Board's report and MD&A at page 82, the CSR annual report, the BRSR at 128, the corporate governance report at 206, standalone and consolidated statements, and the AGM notice. The whole PDF is 488 printed pages.
The "About the Report" page names the IFRS Foundation's <IR> Framework and SEBI's integrated reporting guidance, the financial and governance frameworks, and the assurance arrangements: Walker Chandiok & Co LLP for the financial statements and governance certification, B S R & Co. LLP for reasonable assurance on BRSR Core and limited assurance on other key indicators, Parikh & Associates for secretarial compliance. It states the period and confirms no significant changes in structure or boundary during the year, which is a slightly generous reading of a year that included a demerger, though the demerger is handled properly elsewhere.
Key number: 30 — cells in the "Interplay of Capitals" grid, each describing how one capital feeds another, with an example.
Strategy and narrative: 4/5
Five strategic priorities are set out on page 8 and carried as icons into the value creation model, the segment pages and the stakeholder chapters. The segment pages (Home Care, Beauty & Wellbeing, Personal Care, Foods) each give revenue, EBIT, the year's brand actions and the priorities they serve.
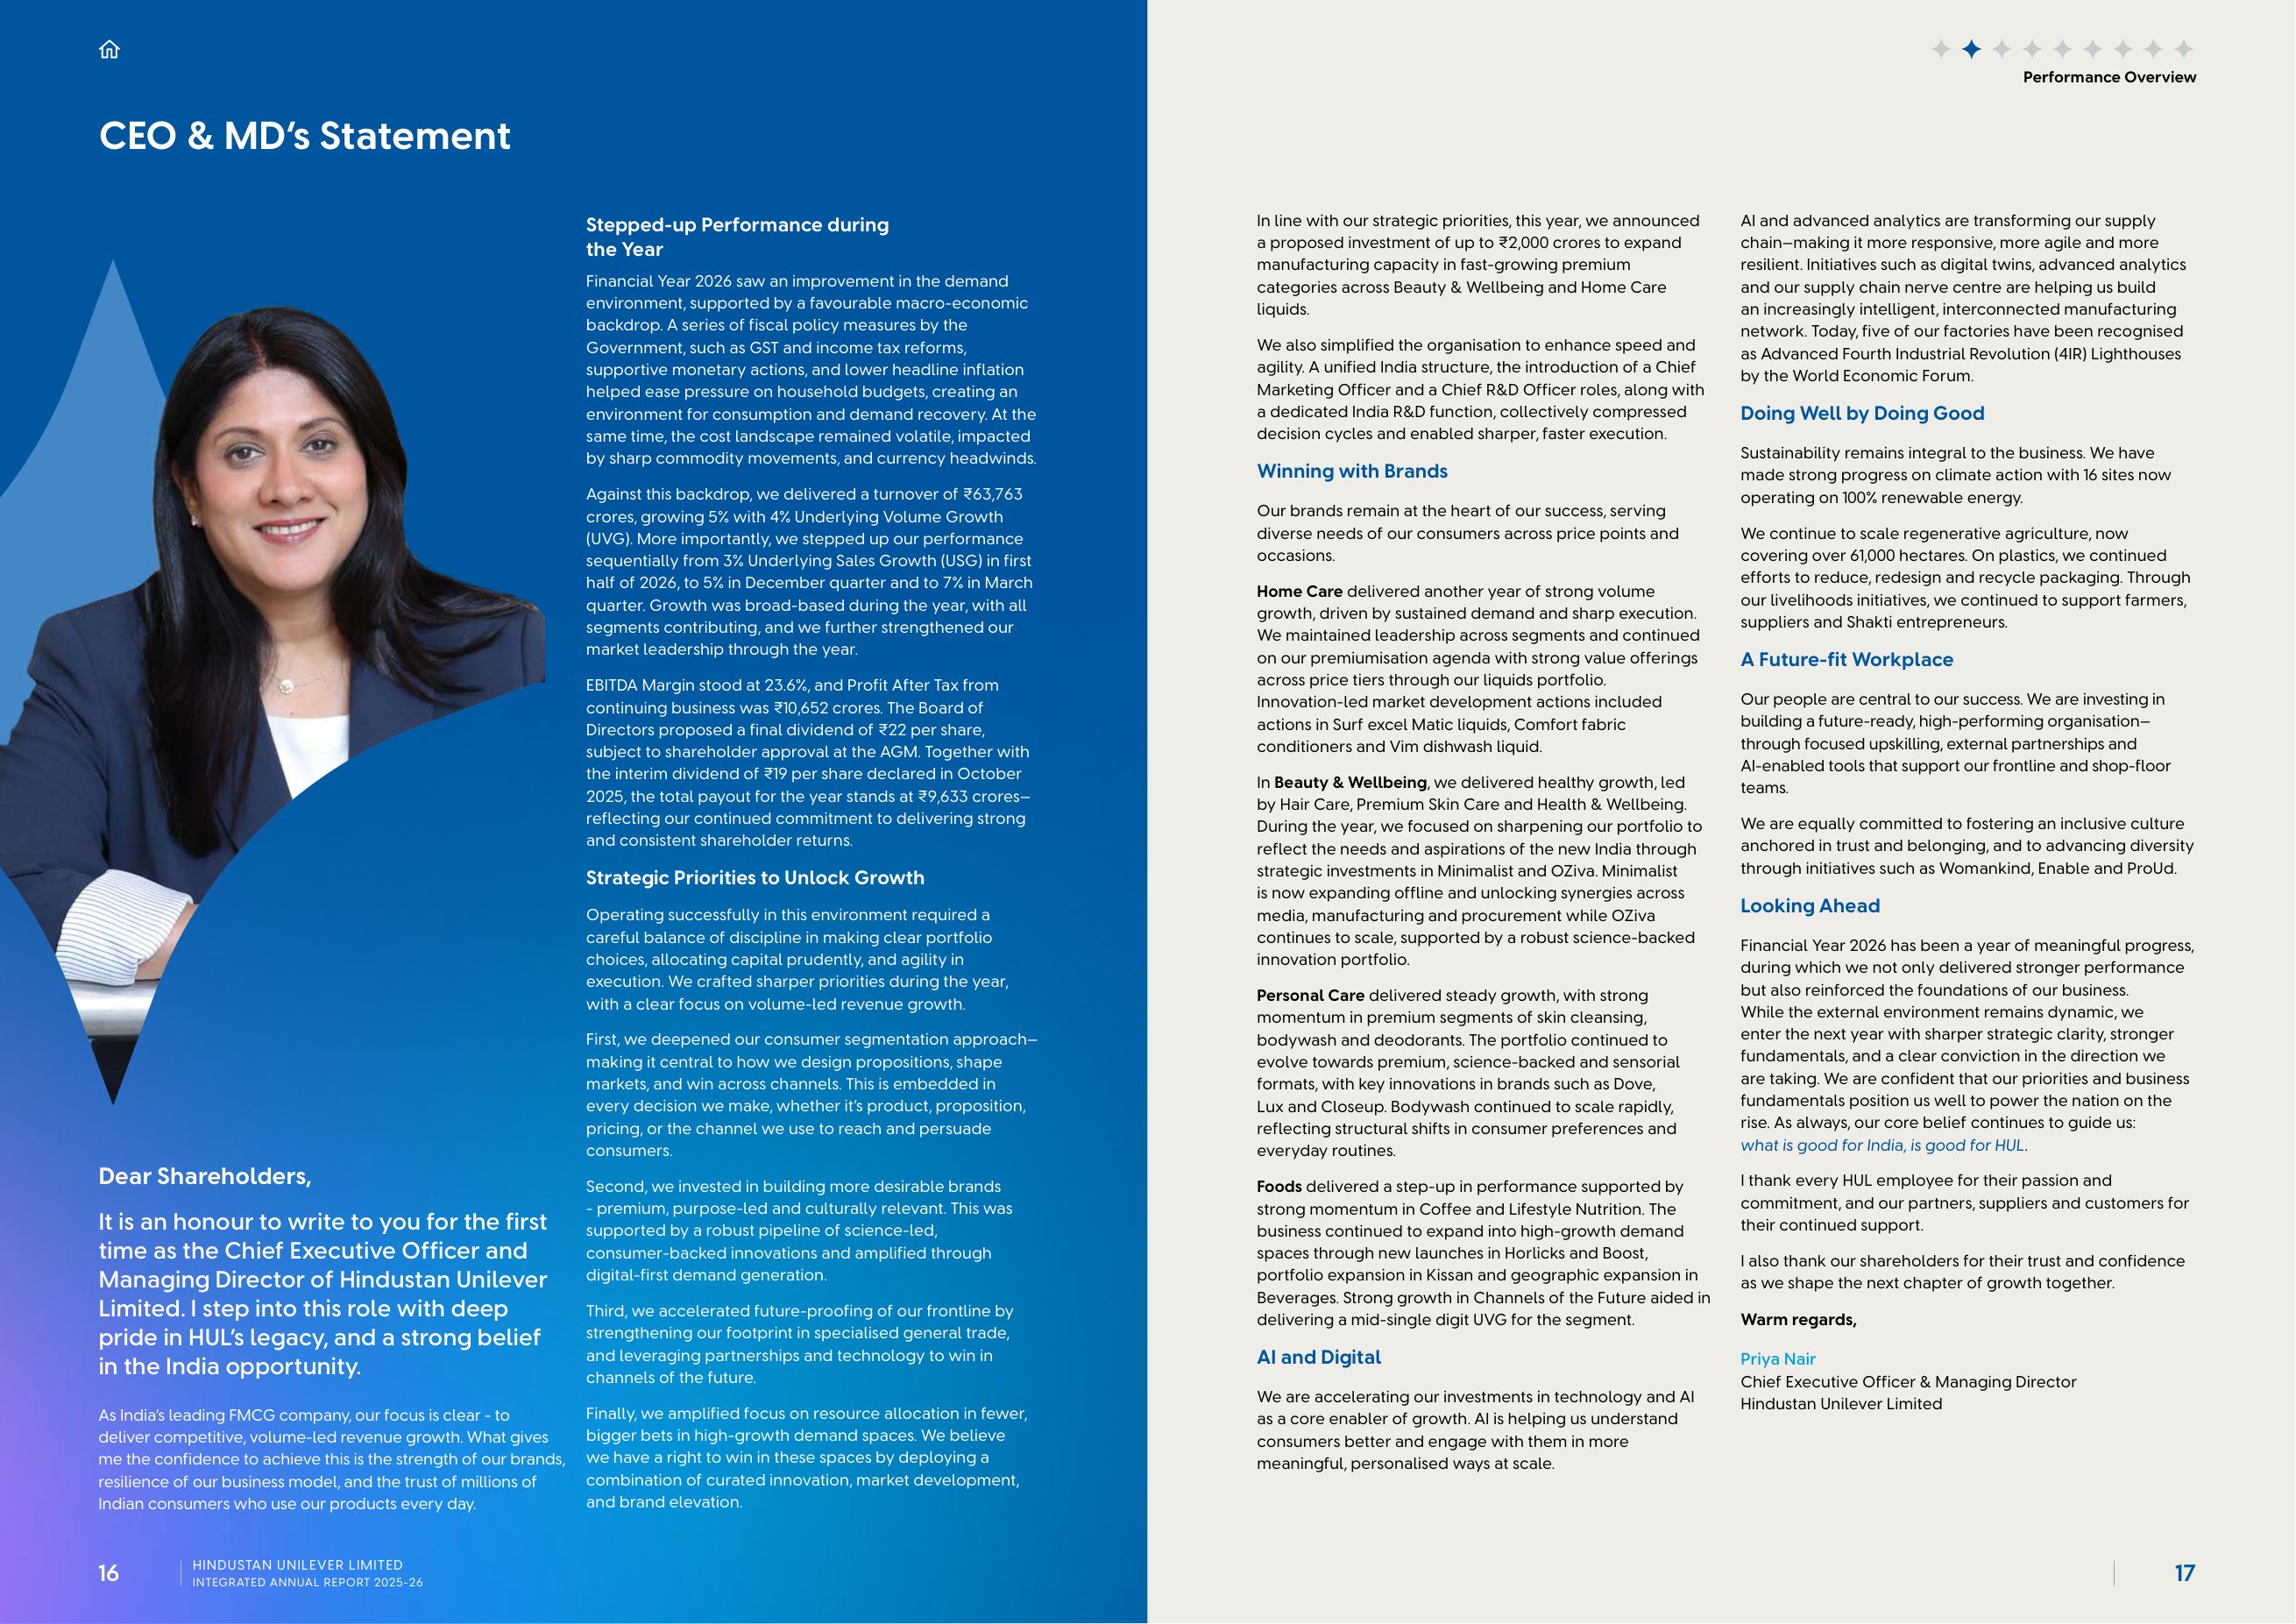
The Chairman's statement records the succession: the appointment of Priya Nair as CEO and Managing Director, succeeding Rohit Jawa, with a paragraph of thanks that credits the outgoing CEO with "decisive actions" through "a challenging period". The CEO's letter that follows is her first, and it is a model of how to open one: by the second paragraph the reader has turnover of ₹63,763 crore up 5%, underlying volume growth of 4%, the quarterly acceleration in underlying sales growth from 3% to 5% to 7%, an EBITDA margin of 23.6%, PAT from continuing business of ₹10,652 crore and a proposed ₹22 final dividend.
The "Featured Stories" (Lighthouse factories, the Nano distribution centre, the supply chain) are well made and, as in Airtel's report, sit somewhere between disclosure and marketing.
Integrated thinking and the capitals: 5/5
The value creation model gives each capital a purpose statement and a set of figures (800-plus scientists; 12 million-plus individuals reached through community interventions; 26 own manufacturing units; ₹273 crore of CSR; 85 billion-plus consumer touchpoints; trade working capital of ₹(4,023) crore; turnover of ₹63,763 crore; PAT of ₹9,062 crore before the continuing-operations adjustment), maps each to stakeholders and to the strategic priorities, and lists outcomes.
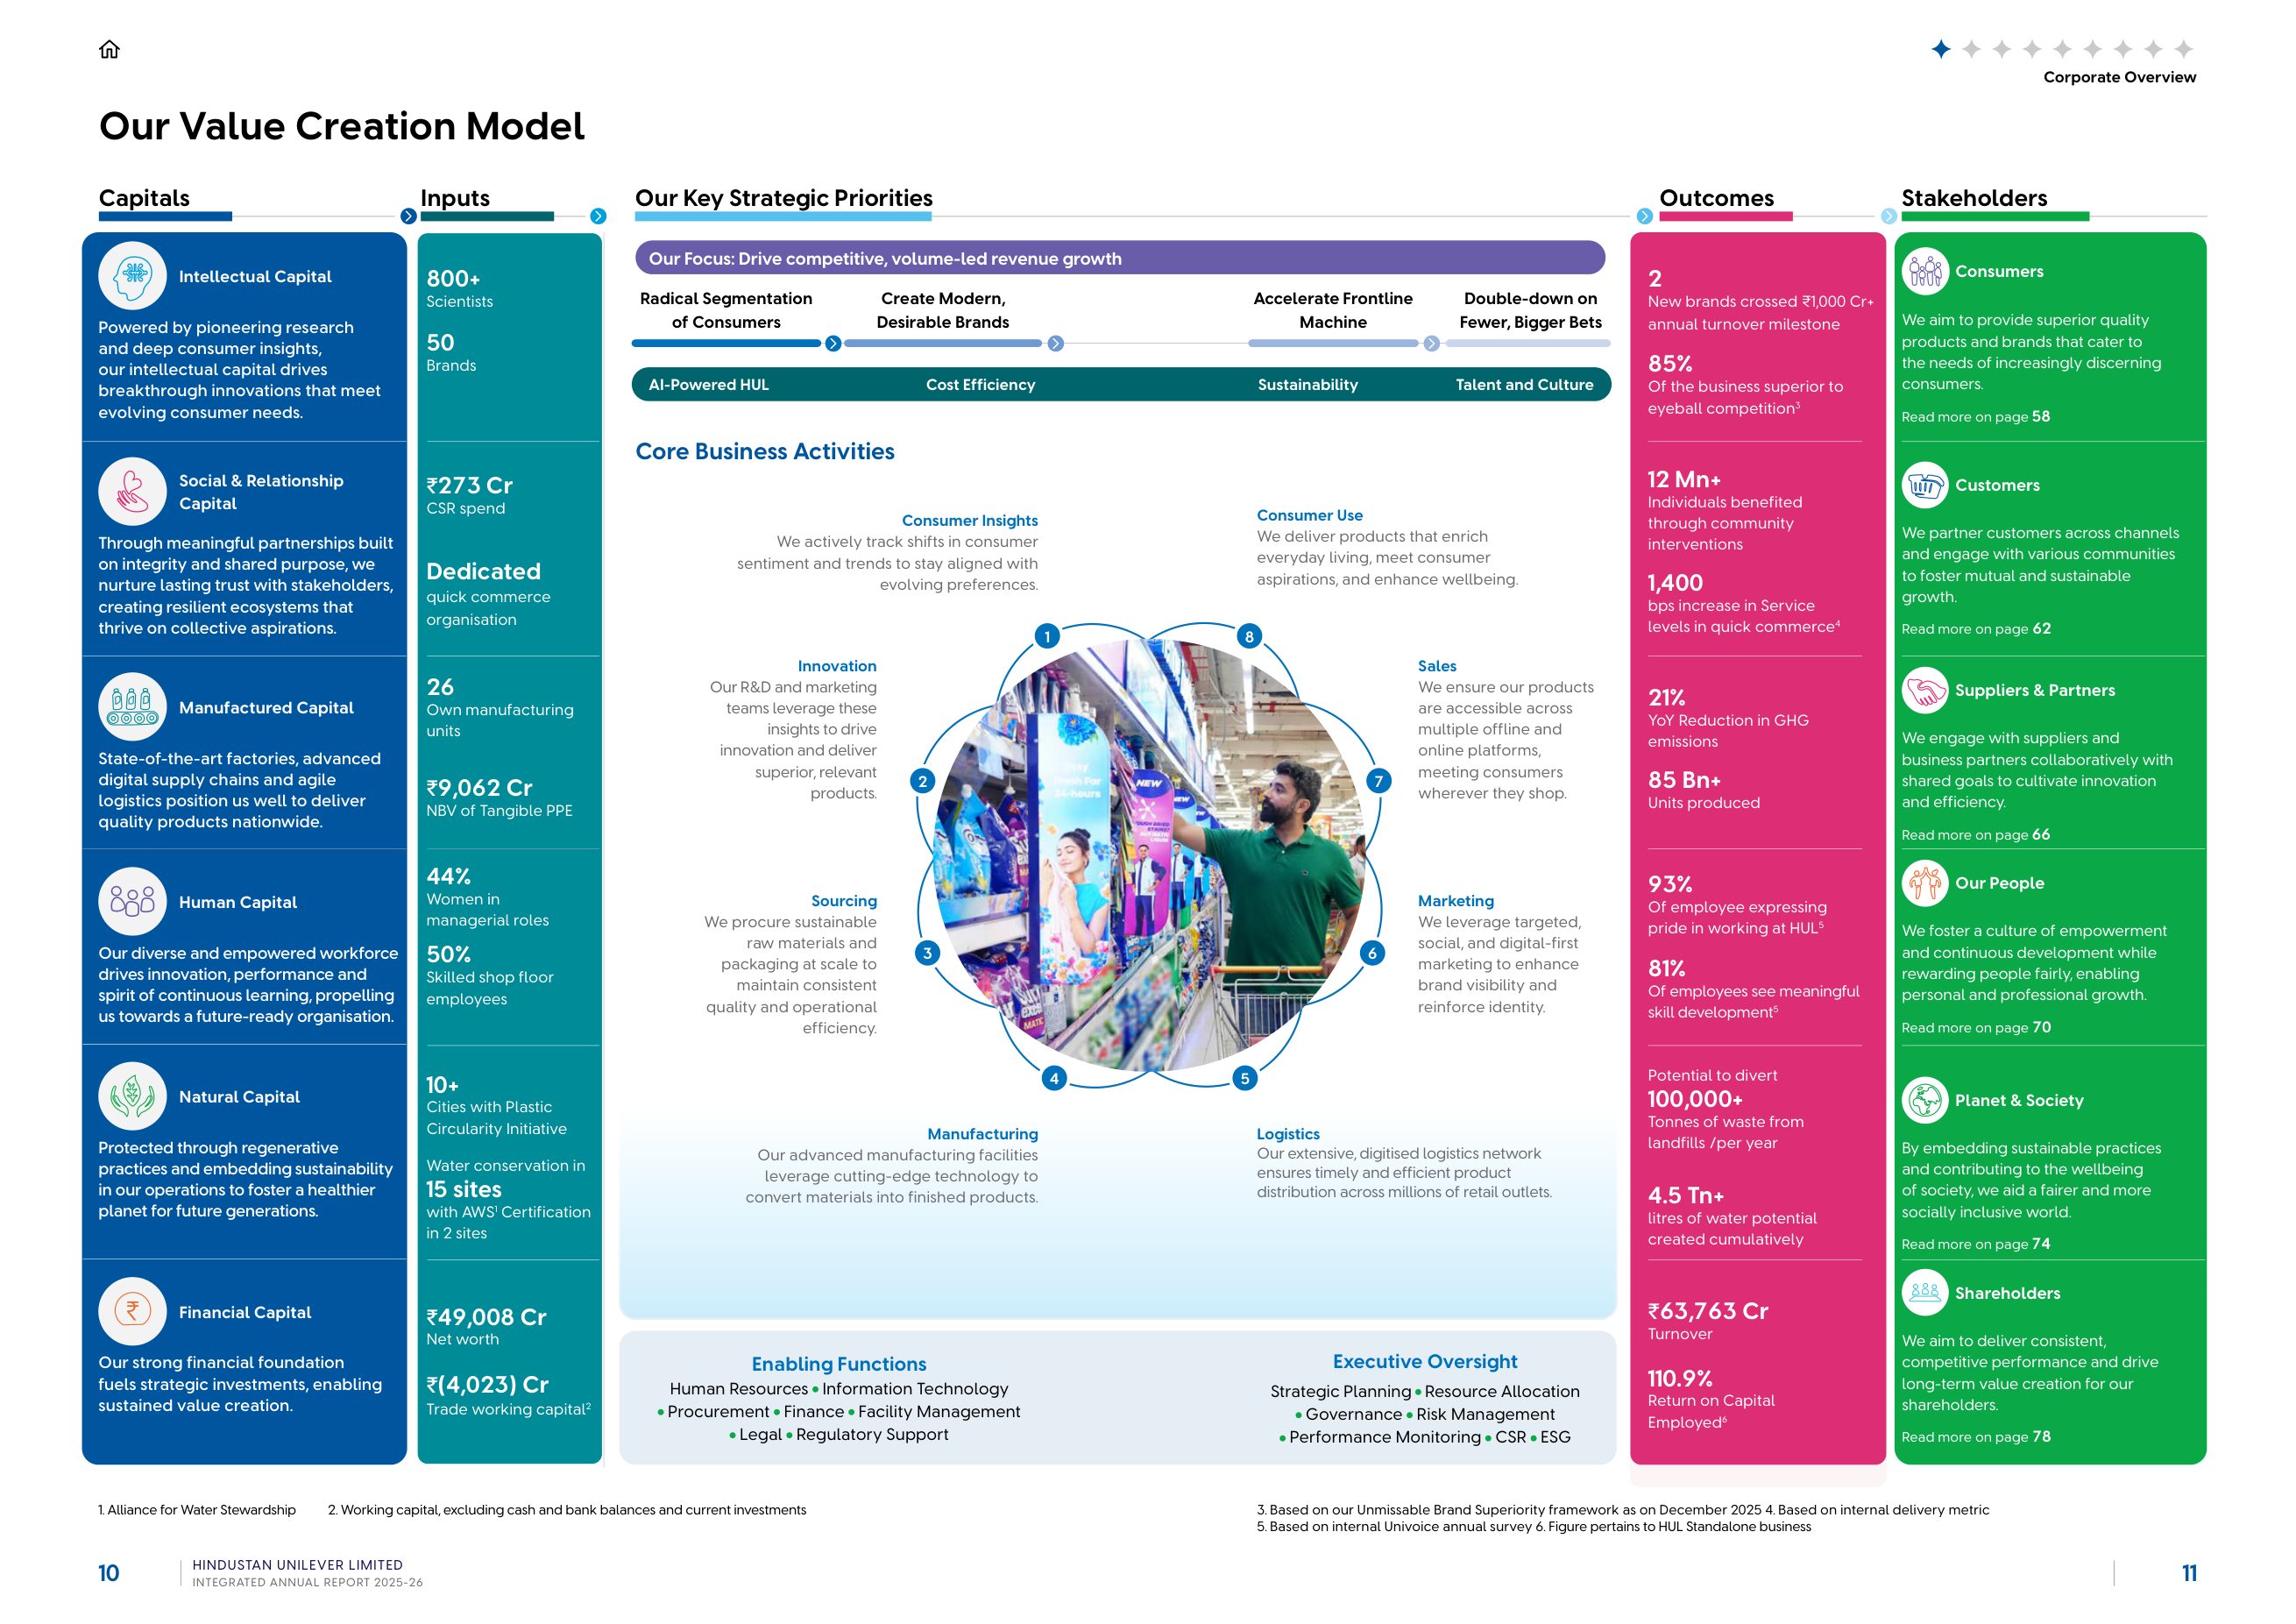
The page that follows is the reason for the score.
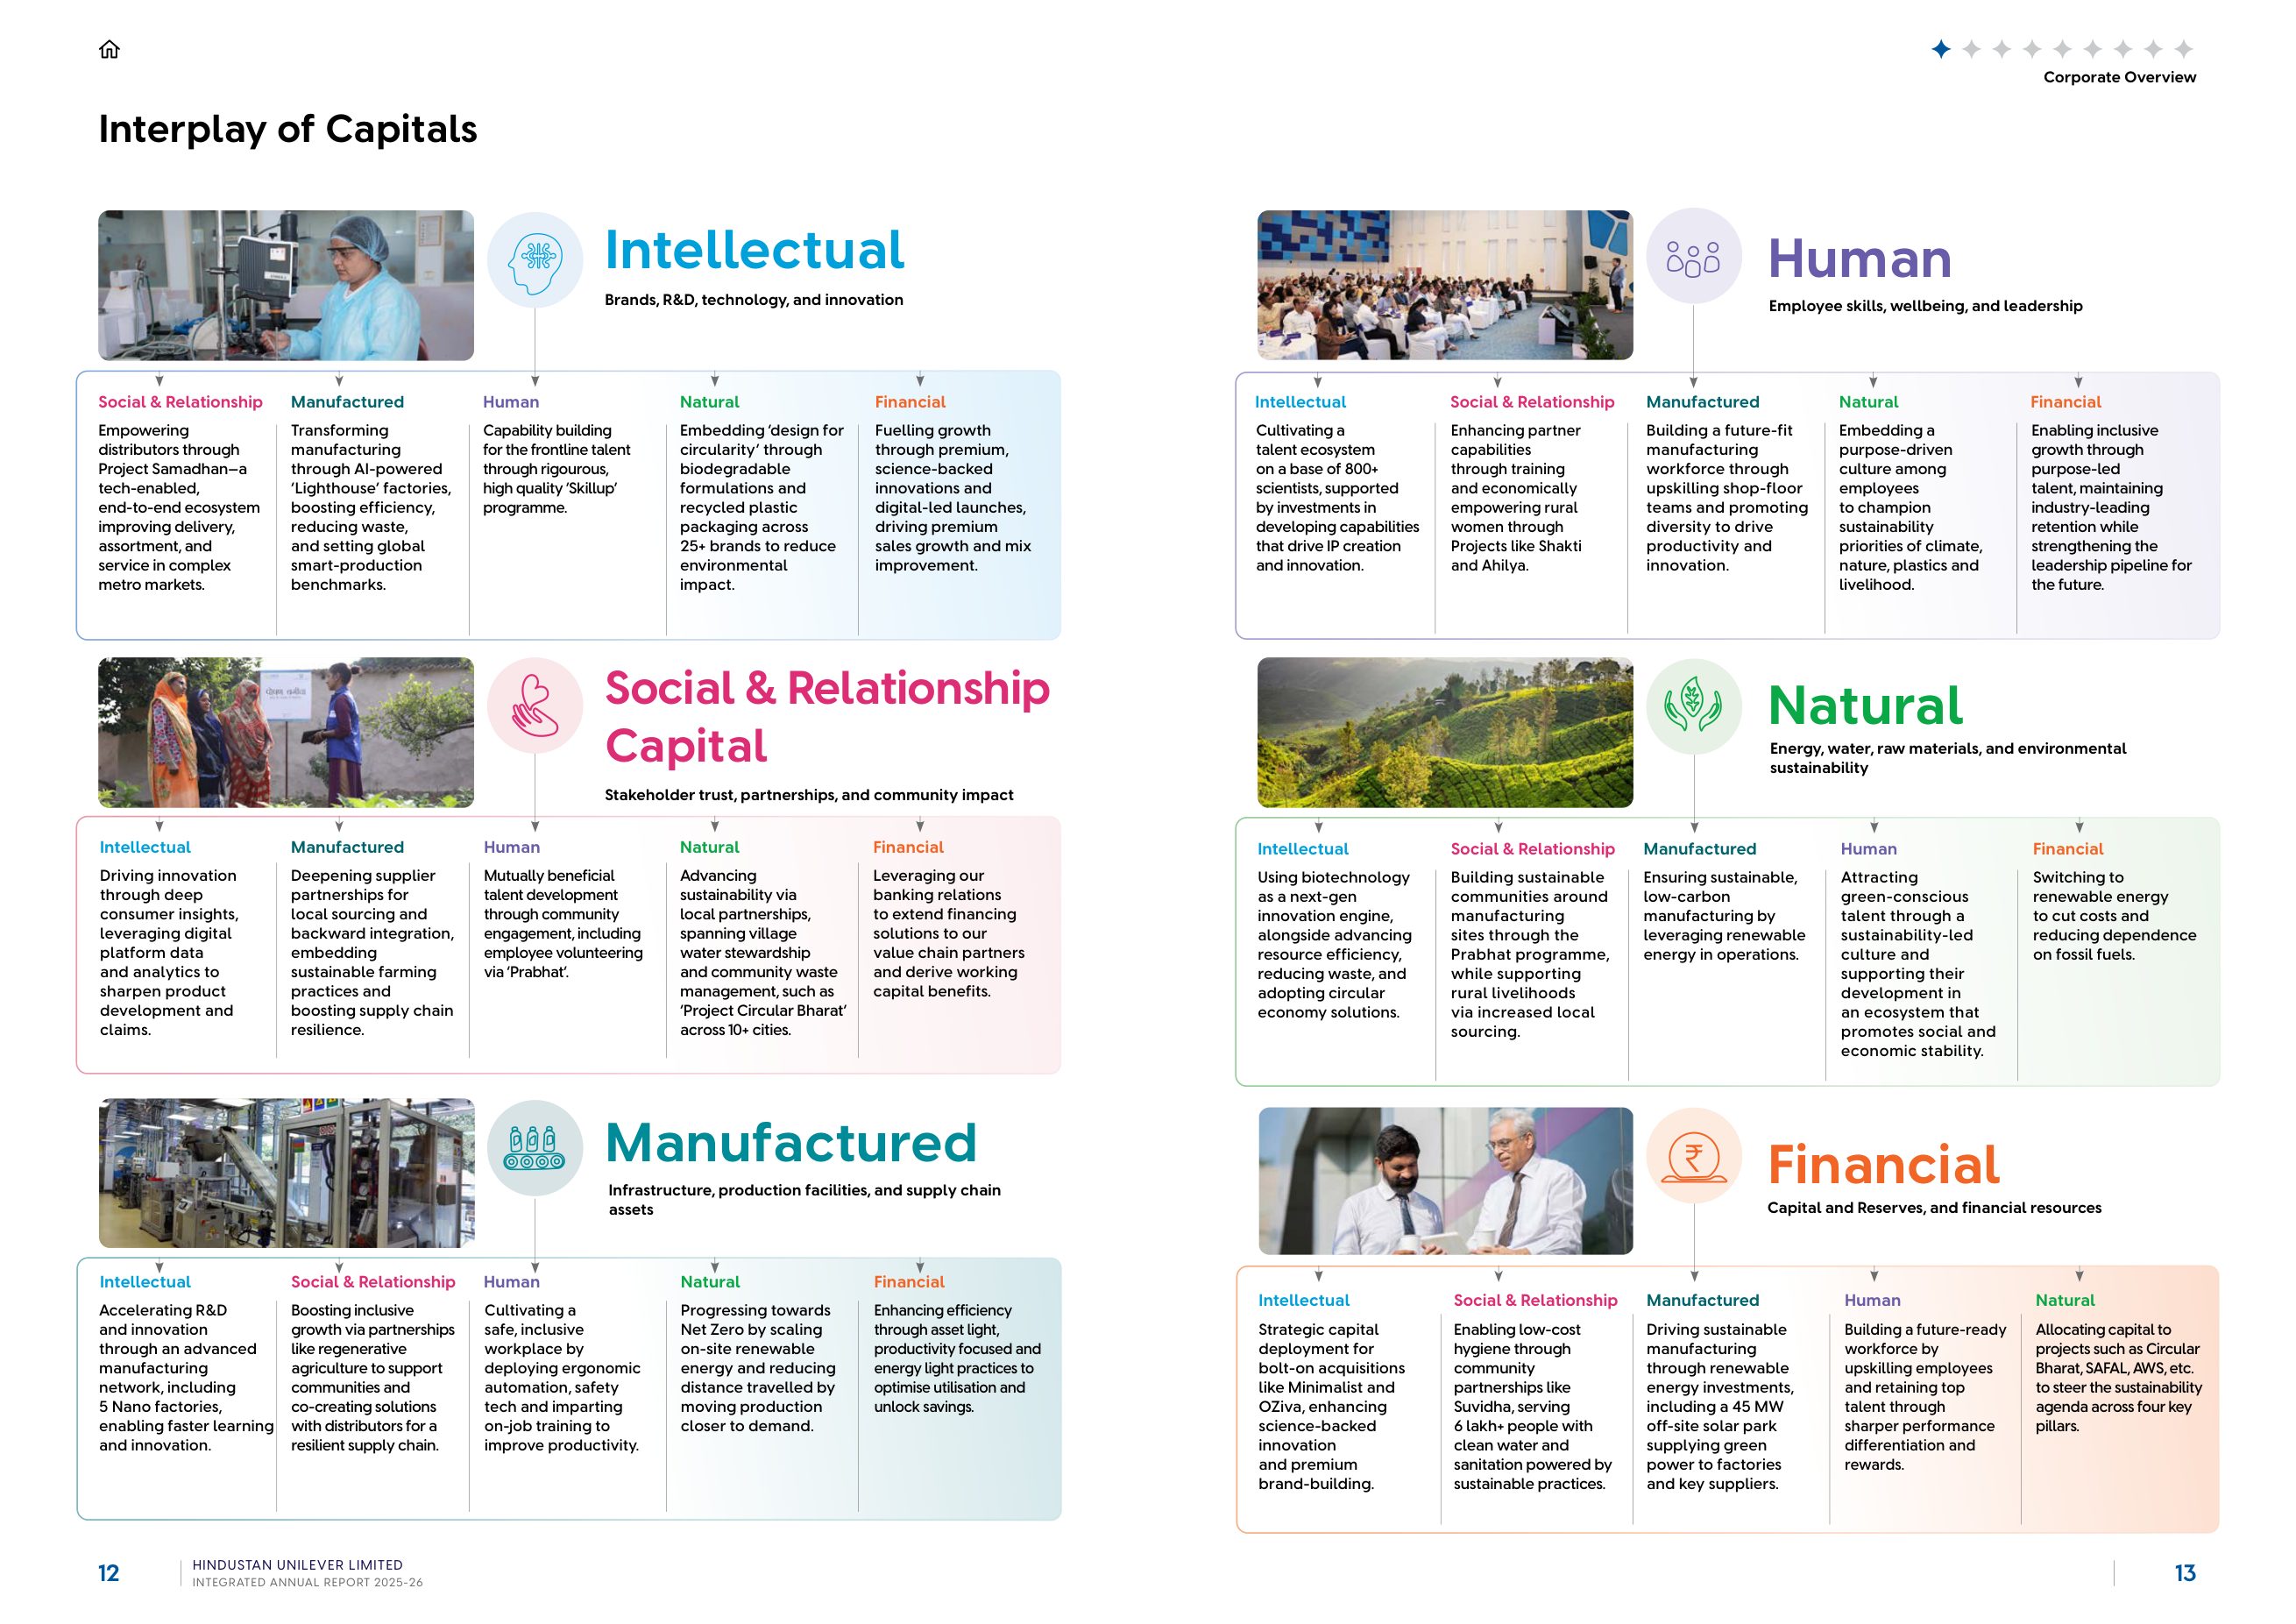
"Interplay of Capitals" takes each of the six capitals and writes five cells beneath it, one for each other capital, describing the contribution with a specific example. Intellectual to manufactured: AI-powered "Lighthouse" factories. Financial to manufactured: a 45 MW off-site solar park supplying factories and key suppliers. Financial to intellectual: the Minimalist and OZiva acquisitions. Natural to financial: switching to renewable energy to cut costs. Human to intellectual: a talent ecosystem on a base of 800-plus scientists. Manufactured to natural: five Nano factories reducing distance travelled. Thirty cells, thirty examples. This is the <IR> Framework's connectivity of information made literal, and it is the page every reporting team should photograph.
The stakeholder chapters that follow (consumers, customers, suppliers and business partners, people, planet and society, shareholders) organise the year by relationship rather than by capital, and each carries the capitals affected. It is a second cut through the same material, and it works.
BRSR and ESG integration: 3/5
The framework is Unilever's, and it is clear: absolute Scope 1 and 2 down 100% by 2030 from 2015; Scope 3 forest, land and agriculture emissions down 30.3% and energy-and-industrial emissions down 42% by 2030 from 2021; net zero across the value chain by 2039; 95% of key crop volumes verified sustainably sourced; regenerative agriculture on a million hectares; a million hectares of ecosystems protected or restored. The roadmap page lays these out under climate, nature, plastics and livelihoods.
The presentation is where the score is lost. The ESG highlights page leads with "99% reduction in Scope 1 & 2 emissions in operations (kg/tonne of production)", "49% reduction in total energy consumption" and "58% reduction in water use", all asterisked "against 2008 baseline". They are intensity measures over eighteen years; they are real achievements; and they are not what the 2030 target measures, which is absolute emissions from 2015. The BRSR gives the absolute numbers: Scope 1 of 7,054 tCO2e, and Scope 2 "Gross: 2,31,262, Net: 0", the zero arriving after the deduction of International Renewable Energy Certificates purchased for grid electricity. Presenting the total of Scope 1 and 2 as 7,054 tCO2e, which the BRSR table does, is a market-based accounting choice that the GHG Protocol permits and that a reader should be told about above the line rather than in a double-asterisk footnote. Scope 3 within the net-zero boundary, at 1,05,35,856 tCO2e, is fifteen hundred times larger than Scope 1 and rose 5.8% in the year; it does not appear in the integrated section.
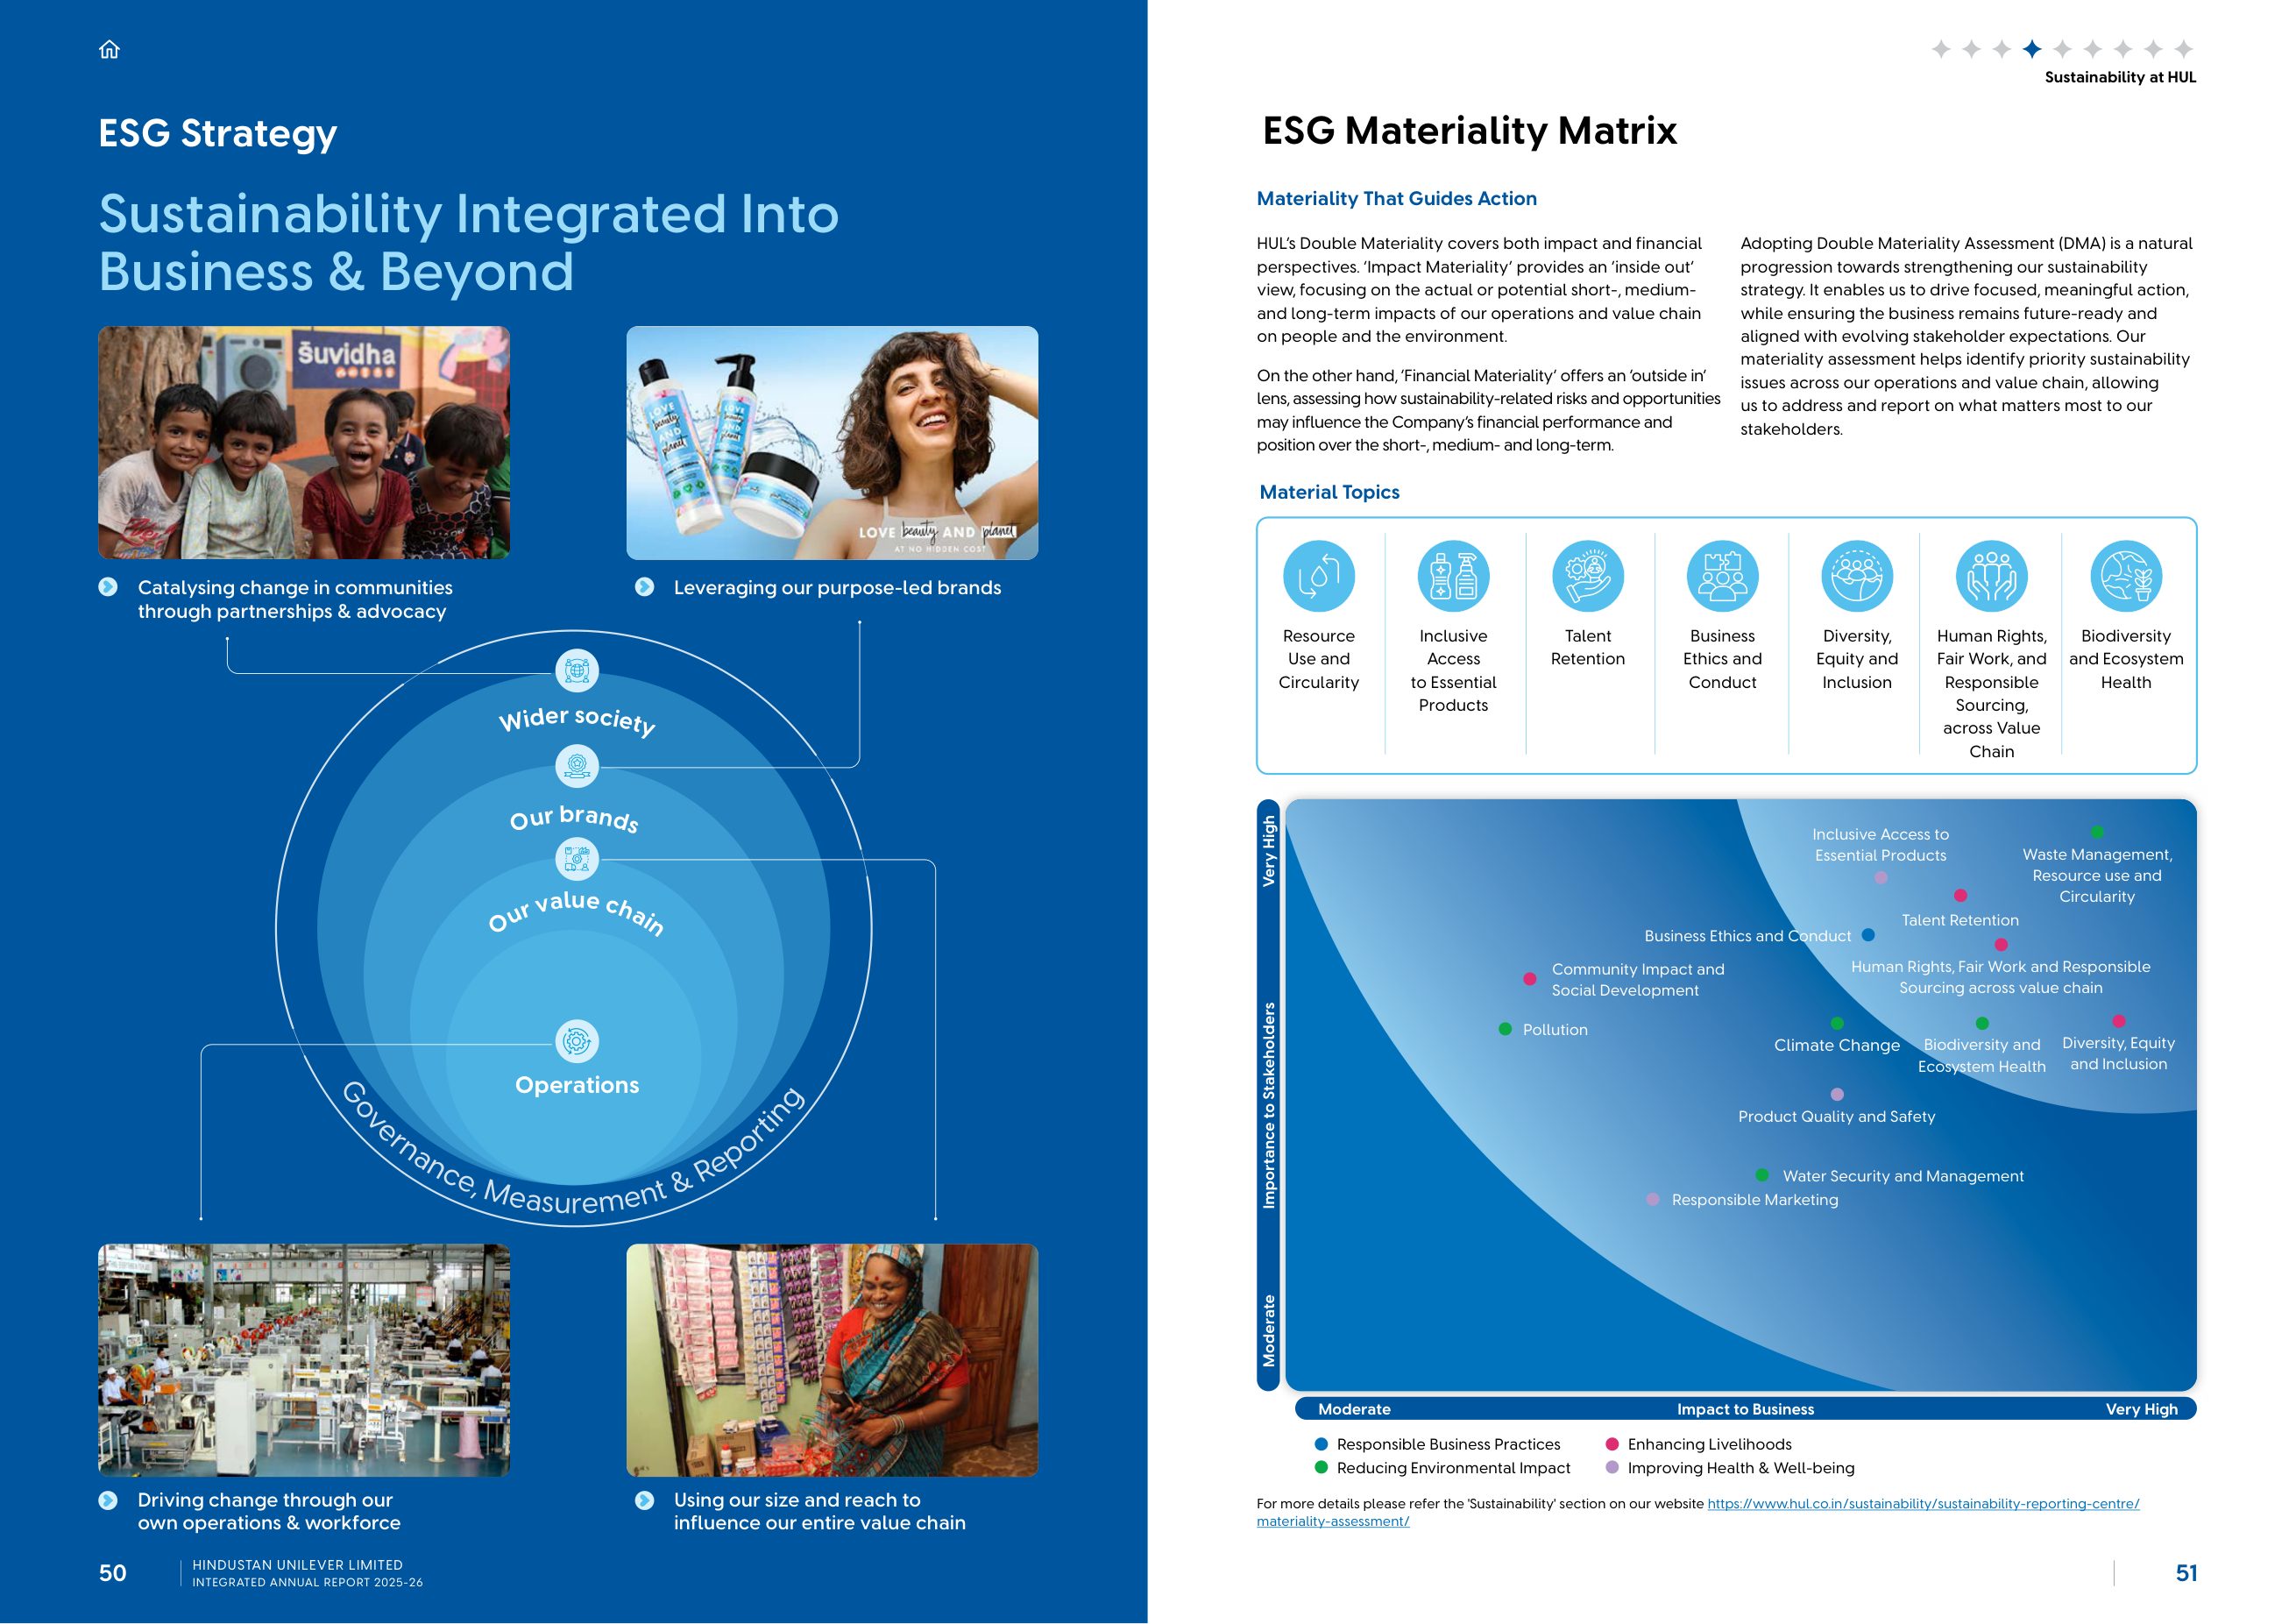
The materiality page says HUL's approach is double materiality, "inside out" and "outside in", and then plots 17 topics on axes labelled "Importance to Stakeholders" and "Impact to Business". Those are the axes of a conventional matrix; a double materiality plot has impact materiality on one axis and financial materiality on the other. The assessment itself, its date and its method are on the website, by reference. Against Hindustan Zinc's rupee thresholds or HDFC Bank's eight-step method, this is a placeholder.
B S R's reasonable assurance on BRSR Core and limited assurance on other indicators, with the statement inside the BRSR, keeps the score at 3 rather than lower.
Governance disclosure: 4/5
The governance overview is unusually well organised: philosophy and structure, Board, a "governance highlights" page, the management committee, and a business integrity and compliance page with the year's data. The CEO succession is disclosed in the Chairman's statement with the reasons for thanks, and the new CEO signs her own letter. A statement of Board responsibility for the integrated report, of the kind HDFC Bank and Hindustan Zinc include, is the missing item.
Financial storytelling: 5/5
The financial highlights spread is the best in the series for a reader who wants context. The headline tiles (turnover, EPS, EBITDA margin, cash from operations, PAT, ROCE) are followed by segment revenue and EBIT for five segments, a "long-term track record" of turnover, EPS and dividend, an eleven-year balance sheet (property, plant and equipment; intangibles, which jump from ₹519 crore to ₹45,327 crore in 2020-21 with the GSK Consumer merger, and to ₹49,246 crore this year), and eleven years of ratios: fixed asset turnover, PAT to turnover, ROCE, RONW, and EVA.
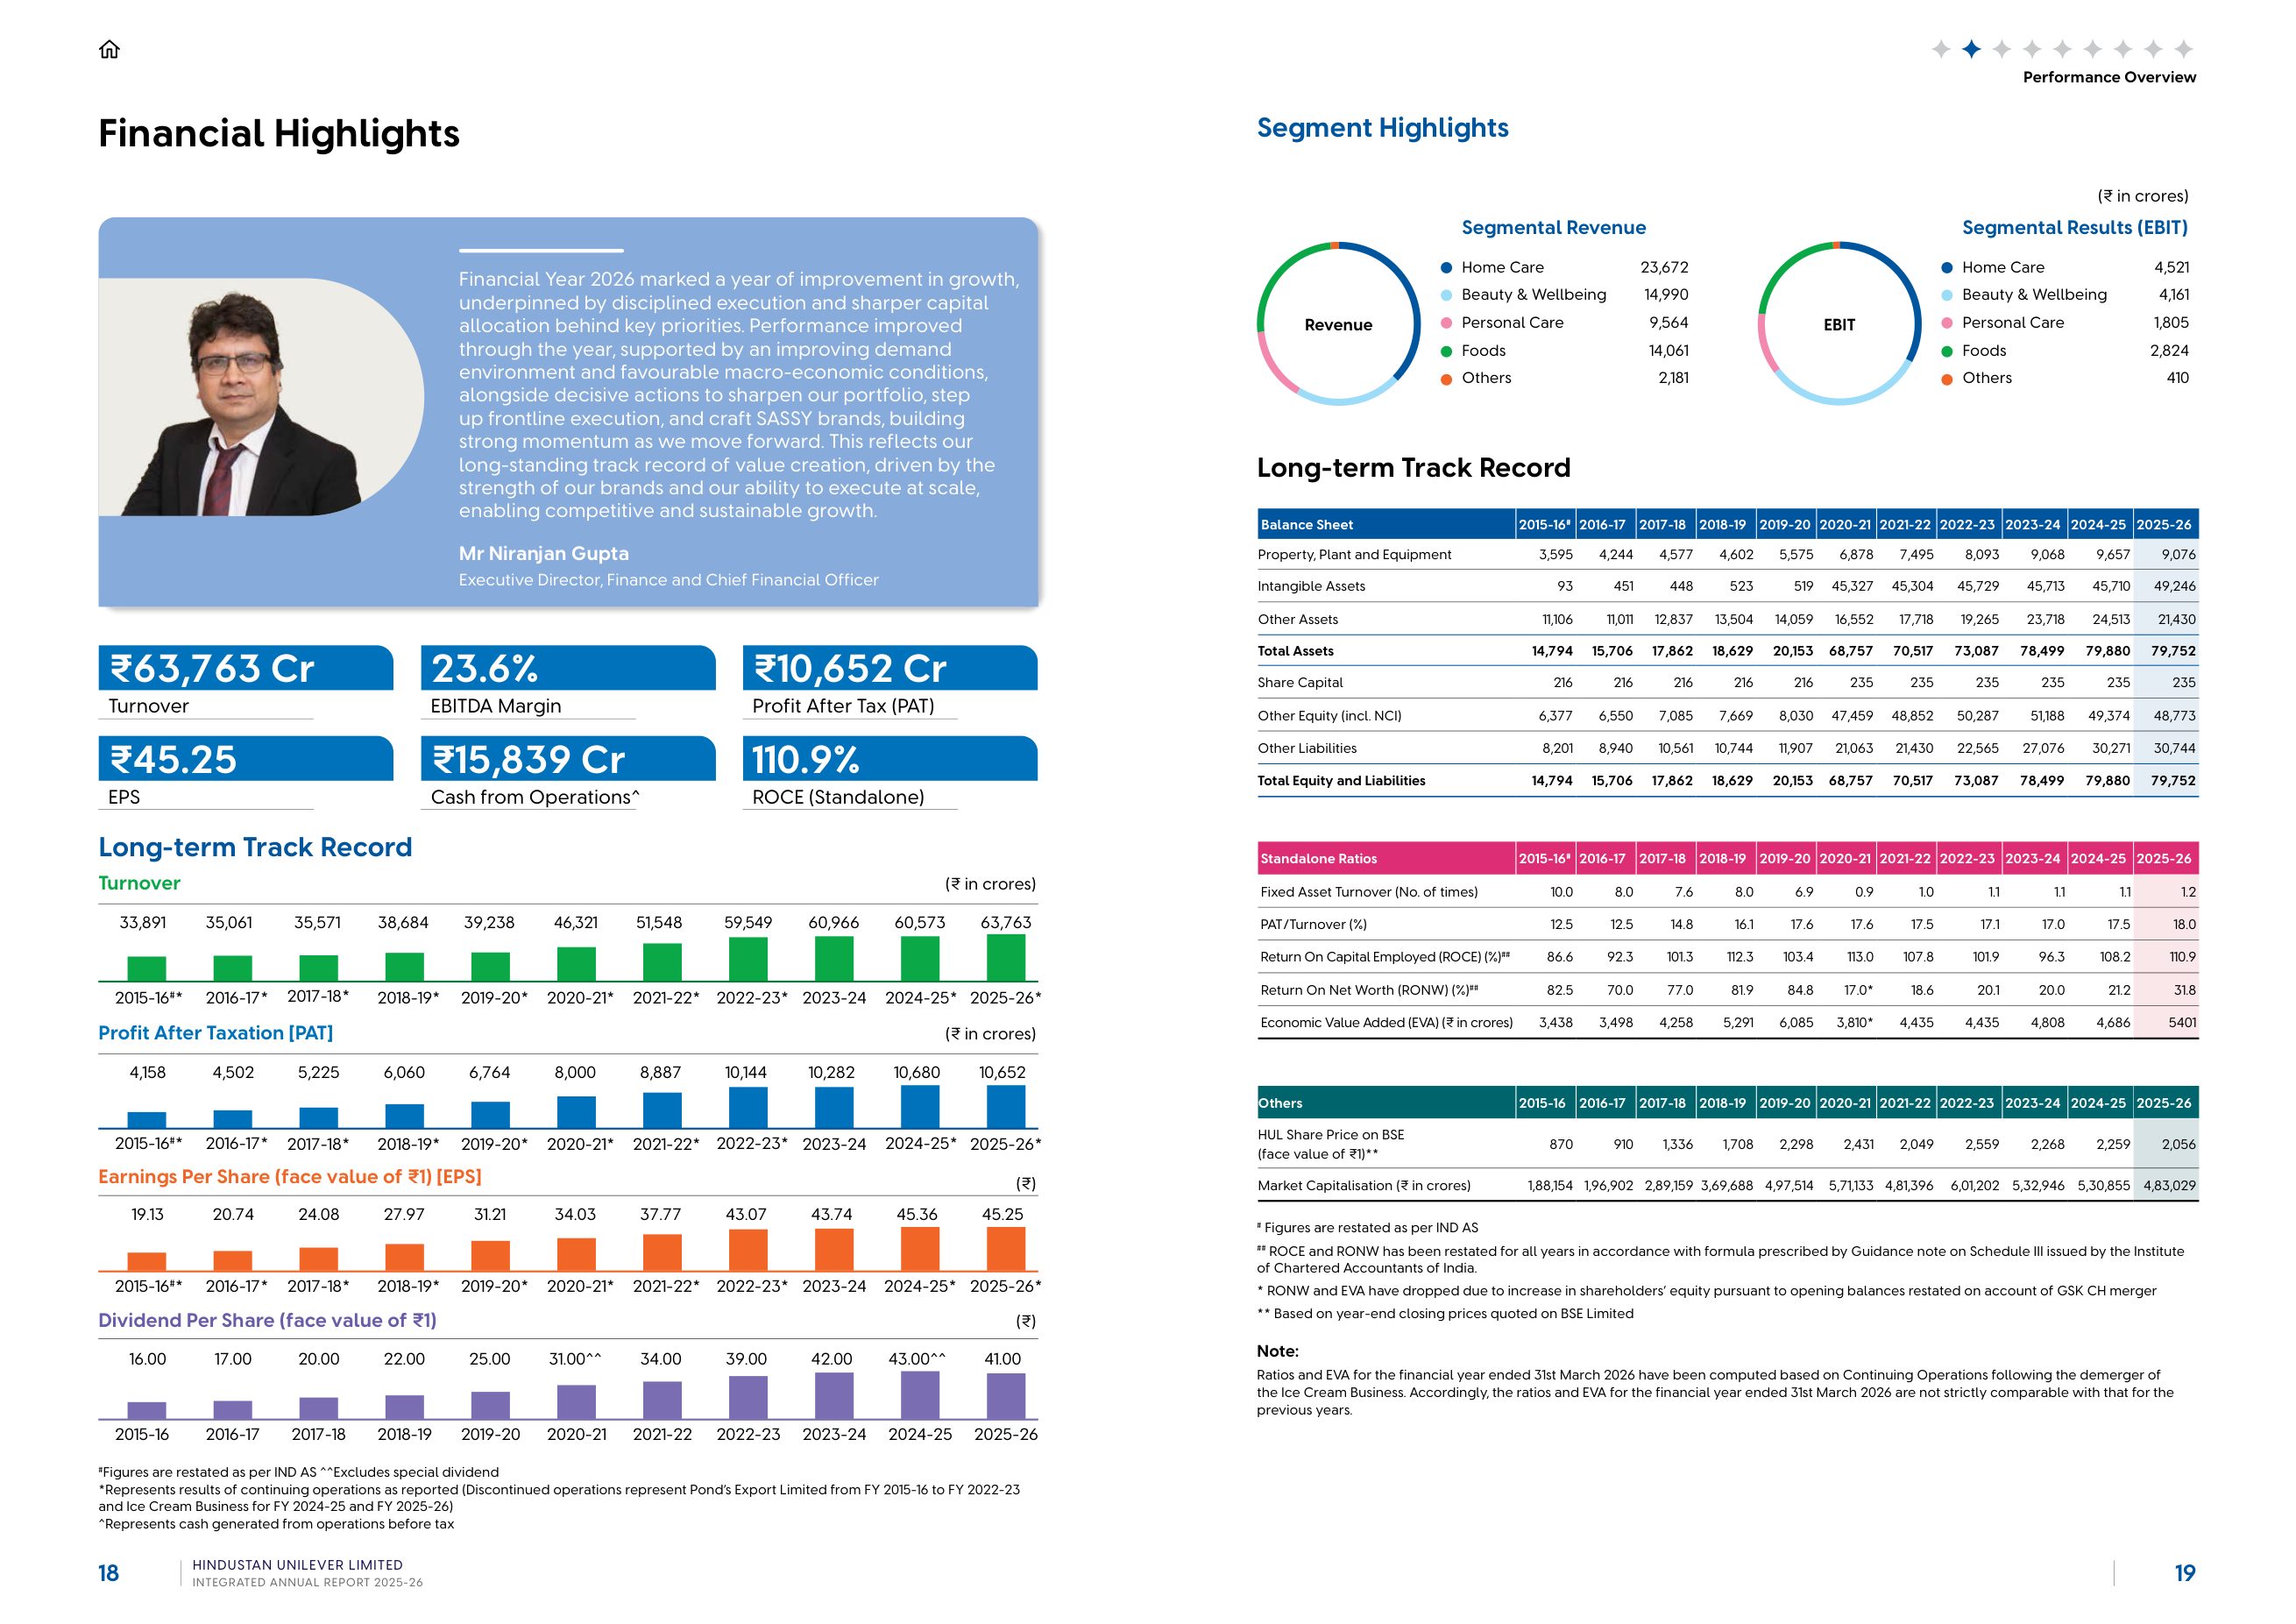
Two footnotes do the honest work. One states that figures are for continuing operations, that discontinued operations represent Pond's Export from 2015-16 to 2022-23 and the ice-cream business for the last two years, and that FY 2025-26 ratios and EVA "are not strictly comparable" with prior years as a result. The other defines cash from operations as before tax. A reader is told exactly what basis each number is on, and why it changed. That is what the TCS and Airtel highlights pages don't do.
Design and readability: 4/5
The integrated section is compact, the icon system for capitals, stakeholders and priorities is used consistently from the about-the-report page, and the segment and stakeholder chapters follow a fixed template. The report is built as spreads. The featured-story pages and a two-spread awards section are the only excess.
Digital version: 3/5
Bookmarks are complete and every page carries a home icon back to the contents. There is no online integrated report referenced, and the materiality assessment and much of the ESG detail are on the website by link, so the PDF is not self-contained on the topics where it is weakest.
What reporting teams can take from it
Copy "Interplay of Capitals" as a page, not an idea. Copy the eleven-year table with ratios and the footnote discipline on continuing operations. Copy the new-CEO letter as a form: succession acknowledged by the Chairman, numbers by the second paragraph.
Then report absolute emissions in the integrated section alongside the intensity headlines, say in the text that Scope 2 is net of purchased certificates and what the gross figure is, give the Scope 3 number the prominence its size demands, and either plot a real double materiality matrix or call it what it is.
Series scorecard
Every report in this series is scored on the same seven-point card by the same reader. Scores are editorial opinion of the published document; each review carries the page references behind its findings.
| Company | Score (of 35) |
|---|---|
| Hindustan Zinc | 30 |
| TCS | 29 |
| HUL (this review) | 28 |
| Reliance | 27 |
| L&T | 27 |
| Bharti Airtel | 27 |
| HDFC Bank | 26 |
| ICICI Bank | 25 |
| Infosys | 25 |
| ITC | 21 |
Frequently asked questions
What is the 'Interplay of Capitals' page in HUL's report?
A two-page grid in the corporate overview in which each of the six capitals (intellectual, human, social and relationship, natural, manufactured, financial) is followed by five statements describing how it contributes to each of the other capitals, with a concrete example in each cell. It is the most explicit treatment of the <IR> Framework's connectivity principle among the reports reviewed in this series.
How does the ice-cream demerger affect HUL's reported numbers?
The financial highlights and the eleven-year track record state that FY 2025-26 figures are computed on continuing operations following the demerger of the ice-cream business, that discontinued operations for FY 2024-25 and FY 2025-26 represent that business, and that ratios and EVA for the year are therefore not strictly comparable with prior years. Profit after tax from continuing business was ₹10,652 crore.
What are HUL's emissions and climate targets?
In the BRSR, Scope 1 emissions were 7,054 tCO2e (8,944 the prior year); Scope 2 was 2,31,262 tCO2e gross and stated as net zero after deducting International Renewable Energy Certificates purchased for grid electricity; Scope 3 within the net-zero ambition boundary was 1,05,35,856 tCO2e (99,62,535 the prior year). Targets follow Unilever's: absolute Scope 1 and 2 down 100% by 2030 from a 2015 baseline, Scope 3 FLAG emissions down 30.3% and energy-and-industrial emissions down 42% by 2030 from 2021, and net zero across the value chain by 2039.
Does HUL do a double materiality assessment?
The report describes 'HUL's Double Materiality' as covering impact and financial perspectives and presents a matrix of 17 topics. The matrix axes are labelled 'Importance to Stakeholders' and 'Impact to Business', which is the format of a conventional single materiality matrix, and the page directs readers to the sustainability reporting centre on HUL's website for the assessment itself. The report does not date the assessment or describe the scoring.
Who assures HUL's BRSR?
B S R & Co. LLP, Chartered Accountants, provides reasonable assurance on BRSR Core indicators and limited assurance on other key sustainability indicators, with the assurance statement included in the BRSR. Walker Chandiok & Co LLP audits the financial statements and certifies corporate governance compliance.
How does The Footnotes score annual reports?
Seven criteria, each scored 1 to 5 with a one-line reason: strategy and narrative; integrated thinking and capitals; BRSR and ESG integration; governance disclosure; financial storytelling; design and readability; and the digital version. Scores are editorial opinion based on the published document, and the same card is used for every company so results can be compared.
Sources
- Hindustan Unilever — Integrated Annual Report 2025-26 (PDF) — Hindustan Unilever Limited
- Hindustan Unilever — Sustainability reporting centre: materiality assessment — Hindustan Unilever Limited
- Integrated Reporting Framework (IFRS Foundation) — IFRS Foundation
- SEBI circular: BRSR Core — framework for assurance and ESG disclosures for value chain (12 July 2023) — SEBI