


HCLTech prints its falling profit and a negative one-year shareholder return where most companies would hide them, then lets its environmental pages describe an 11% rise in water use as a fall and leave a 17% jump in Scope 3 emissions to the BRSR.
In this article
 In short
Key takeaways
- The highlights page (p. 9) shows statutory profit after tax of ₹16,642 crore with a down arrow and "4.3% YoY", next to an adjusted EBIT figure whose double asterisk is explained on the next page as excluding a ₹956 crore Labour Codes charge.
- The MD&A prints HCLTech's own total shareholder return for one to ten years (p. 95): −12.3% over one year and −5.4% over two, against 295.7% cumulative over ten. The divider page and value creation model still lead with "best-in-class TSR" without showing a peer comparison.
- Payout is given three ways: 97.6% of net income in both letters (pp. 1 and 5), 87.8% on the highlights page and in the MD&A (pp. 9, 81 and 96), and 89.9% cumulative since FY22 (p. 57). The ₹60 a share behind the 97.6% includes a ₹24 dividend the Directors' Report calls "for FY 2026-27" (p. 127).
- Advanced AI revenue is reported for the first time as an annualised US$620 million (p. 19), about 4% of the year's US$14.7 billion revenue. The report defines the category but not how the annualised figure is calculated.
- The natural capital page (p. 77) lists water consumed as 925,715 KL, "down from 834,013 KL in FY25", an 11% rise. The BRSR (p. 269) gives 811,018 KL against 820,406 KL. Neither page explains the difference.
- Scope 3 emissions rose 16.6% in a year, from 269,567 to 314,411 tCO2e (BRSR, p. 269). The integrated section reports only a 9.56% cut since FY20 against a 42% target for FY30 (pp. 54 and 77).
Official report: Get the HCLTech Integrated Annual Report 2025-26 from the company's website. This page is The Footnotes' independent review of it.
Verdict: HCLTech prints its bad numbers where readers will see them, then loses track of its own numbers once it gets to dividends and the environment. A falling profit and a negative one-year shareholder return are both on the main pages. But the payout ratio changes from page to page, and the environmental section calls a rise in water use a fall. Score: 25 of 35.
Page numbers below are the printed numbers on the report's pages, not PDF page counts. The 462-page PDF on HCLTech's investor relations site starts numbering at the Chairperson's message. The value creation section runs from page 52 to 78, the MD&A from page 79, the Directors' Report from page 126, the BRSR from page 208 and the financial statements from page 285. Screenshots are small excerpts reproduced for review and remain the copyright of HCL Technologies Limited.
A highlights page that shows profit falling (p. 9)
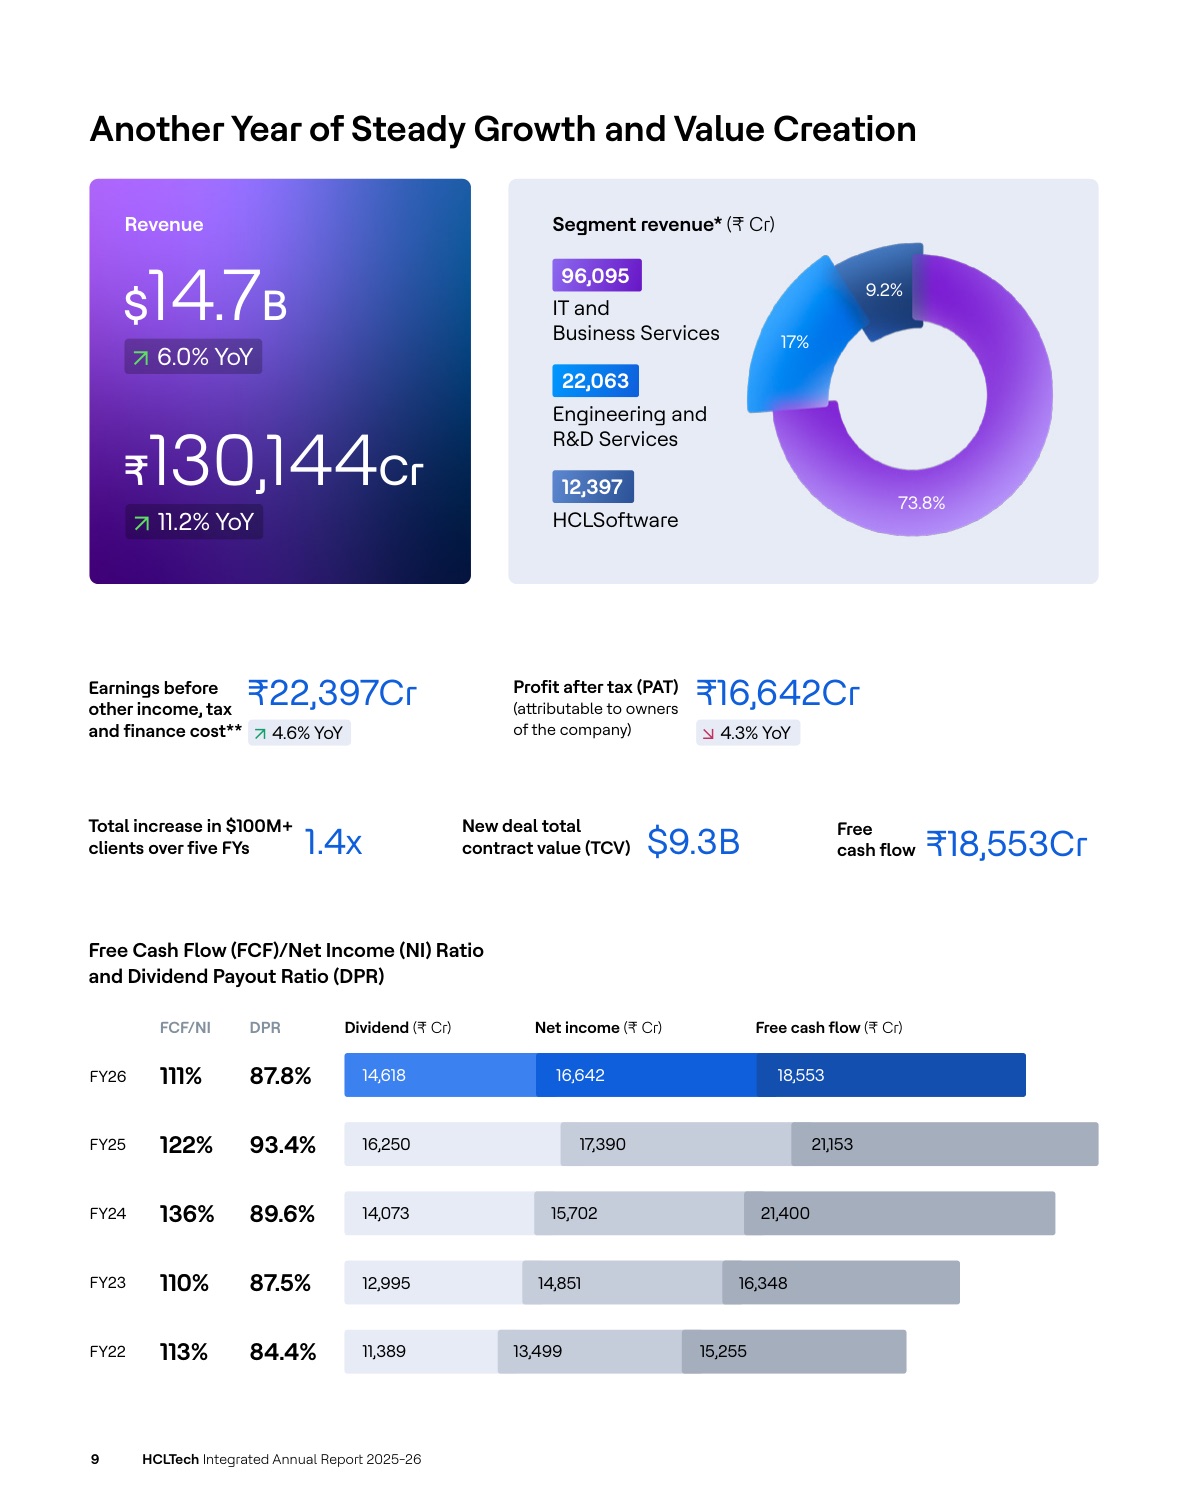
Most Indian highlights pages pick the numbers that went up. HCLTech's shows profit after tax attributable to owners at ₹16,642 crore with a down arrow and "4.3% YoY". The earnings figure beside it, ₹22,397 crore, is adjusted, and it says so: the double asterisk is explained at the foot of the next page as excluding the ₹956 crore one-time impact of India's new Labour Codes (p. 10). The five-year table on the same page keeps the statutory profit, so the FY26 dip is visible against FY25's ₹17,390 crore.
The CEO's letter is in the same spirit. It gives constant-currency revenue growth of 3.9% and says this was "fractionally lower than our guidance" (p. 5). Few chief executives put a missed guidance number in their own letter.
Two things the page leaves out. Constant-currency growth isn't on it, only rupee growth of 11.2% and dollar growth of 6.0%, so the currency tailwind is invisible unless you reach the letter. And HCLSoftware's revenue, "up 2.9%" in rupees in the letter, fell 4.1% in constant currency (MD&A, p. 82). That figure is only in the MD&A.
The shareholder-return chart nobody else prints (p. 95)
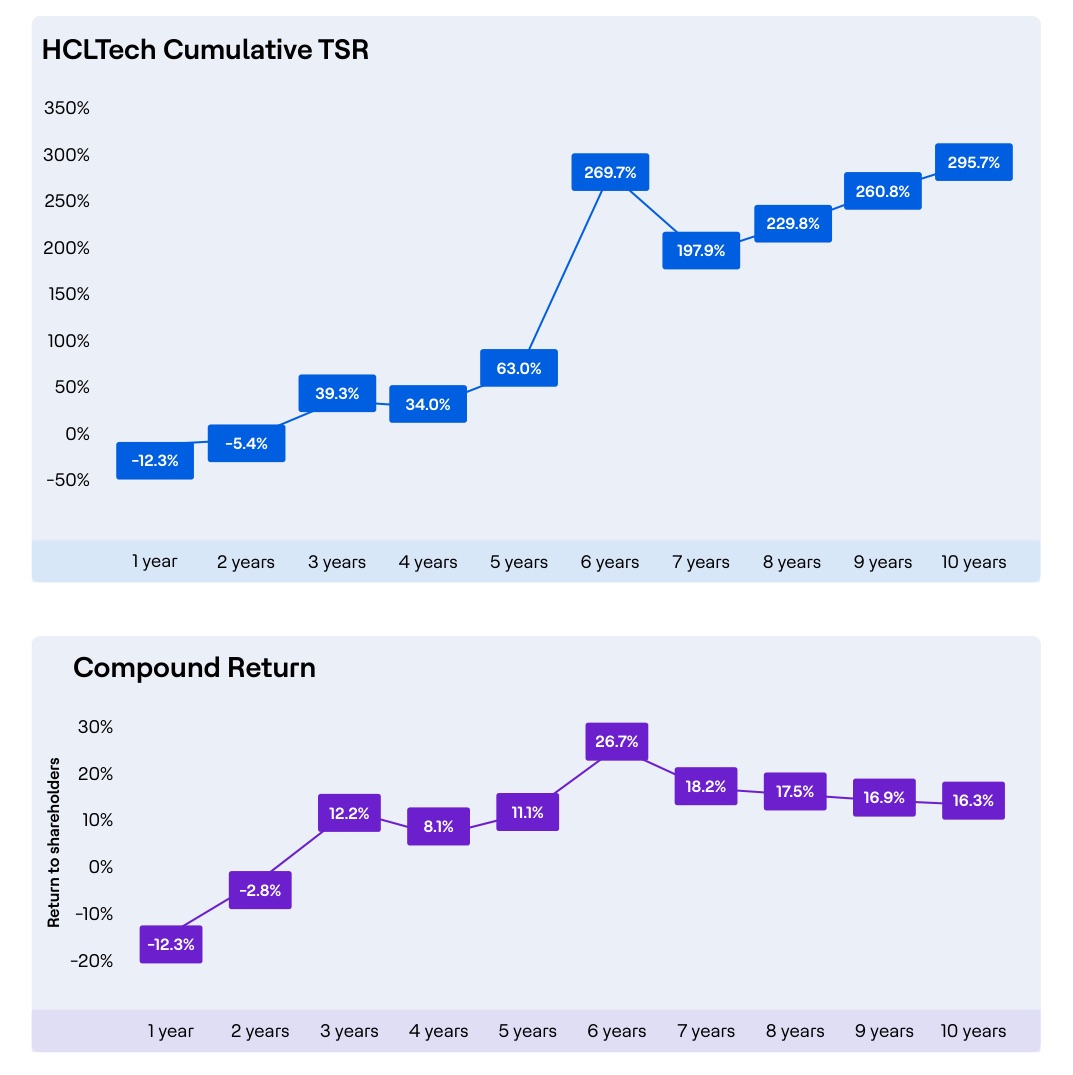
The MD&A charts HCLTech's total shareholder return over every period from one year to ten. The one-year figure is −12.3%, and two years is −5.4%. The ten-year figure is 295.7% cumulative, or 16.3% a year. Printing the whole curve, including the part that went down, is what makes the ten-year number believable. The Chairperson's letter acknowledges it in words too: "near-term prices do not always reflect the fundamentals" (p. 1).
The report then undoes some of that good work. The section divider before the value creation model (p. 52) and the outcomes column of the model itself (p. 54) both lead with "best-in-class TSR over the past 10 years". Nowhere does the report show a peer's TSR to compare against. A claim of being best needs the comparison next to it.
Three payout ratios for one year
- 97.6%Letters to shareholders
Based on ₹60 per share, including ₹24 declared after year-end. The Directors’ Report assigns that ₹24 to FY 2026–27.
- 87.8%Highlights and MD&A
₹14,618 crore paid in cash during FY26 divided by statutory profit of ₹16,642 crore.
- 89.9%Cumulative since FY22
A multi-year measure on the financial capital page.
Source — HCLTech Integrated Annual Report 2025–26, pp. 1, 5, 9, 57, 81, 96 and 127, as cited in this review. Different timing and coverage prevent a direct comparison.
HCLTech's dividend policy is clear: return at least 75% of net income over five years, now extended to FY31 (p. 57). How much it actually returned in FY26 depends on which page you read.
- 97.6% in both the Chairperson's and CEO's letters (pp. 1 and 5). The CEO says the Board approved "a total dividend payout of ₹60 per share". That is three interim dividends of ₹12 paid during the year plus ₹24 declared on 21 April 2026, after the year ended. The Directors' Report describes that ₹24 as an interim dividend "for FY 2026-27" (p. 127).
- 87.8% on the highlights page and twice in the MD&A (pp. 9, 81 and 96). This is ₹14,618 crore of dividends paid in cash during FY26, which includes ₹18 a share declared in April 2025 on FY25's results, divided by ₹16,642 crore of profit.
- 89.9% cumulatively since FY22 (p. 57).
Each number can be defended. The report doesn't reconcile them, though, and the first figure a shareholder sees, 97.6%, counts a dividend the statutory section assigns to the following year. The same pattern shows up in smaller ways. Free cash flow is "107% of net income" in the letter (adjusted profit) and 111% on the highlights page (statutory profit). Profit has a five-year growth rate of 5.4% on page 10 and 6.5% on page 111, where the base is adjusted profit of ₹17,371 crore. One sentence on the highlights page saying which basis is used where would fix all of it.
AI strategy: specific, with one number that needs a footnote
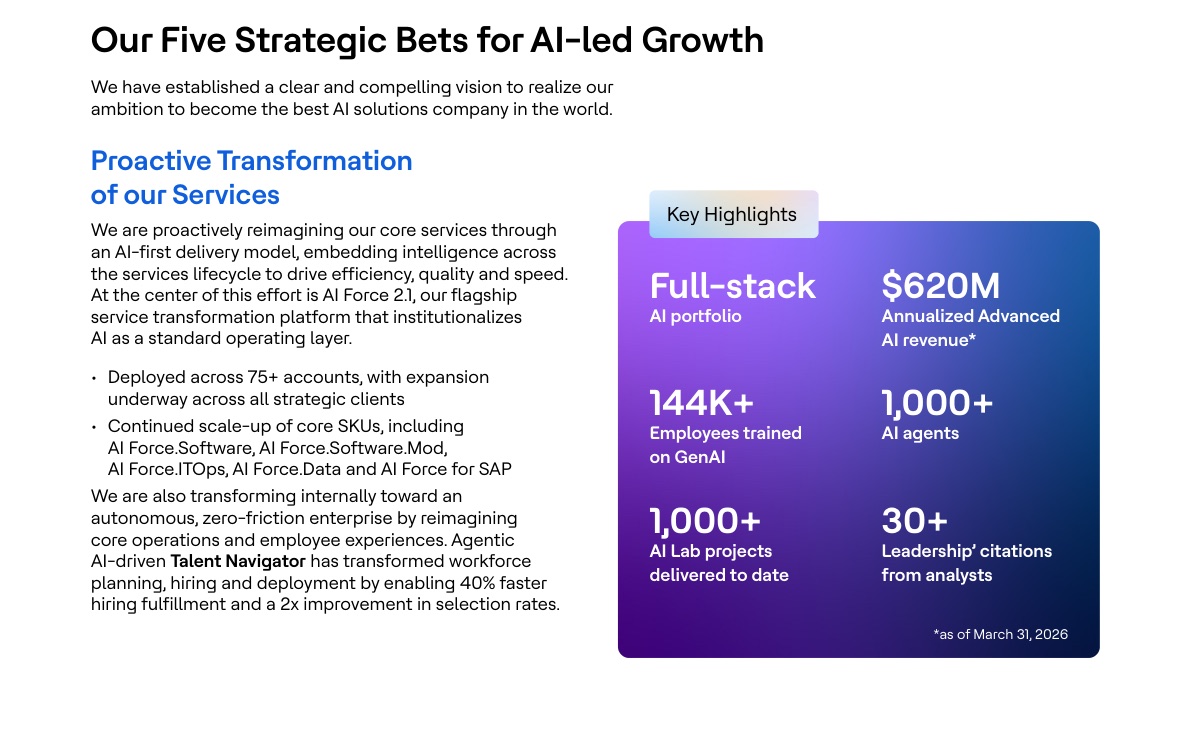
The strategy is easy to follow. The ambition is "to be the best AI solutions company in the world", and the CEO's letter sets out five vectors: transform existing services with the AI Force platform, build IP, open new AI-led businesses (advisory, Physical AI, AI factories), deepen partnerships and retrain staff. Each comes with a number a reader can check next year: AI Force in use at 75 clients; 144,000 employees trained in GenAI, including 11,800 certified "AI Builders" (pp. 4-5).
The headline number is new this year. HCLTech reports annualised Advanced AI revenue of US$620 million, defined as AI Factory, Physical AI, Robotics, AI Engineering and Custom Silicon, separate from older "classical AI" (pp. 3 and 19). That is about 4% of the year's US$14.7 billion revenue. Defining the category is more than most peers do. The report doesn't say how the figure is annualised, though, or what the category actually booked in FY26. Without that, the number can't be compared from year to year.
Two smaller slips suggest pages written separately. The flagship platform is "AI Force 2.1" on page 19 and "AI Force 2.0" on page 85. HCLTech is a Gartner "Customers' Choice" across "all six" voice-of-the-customer reports on page 81 and "all four" on page 64.
The value creation model: numbers in, awards out
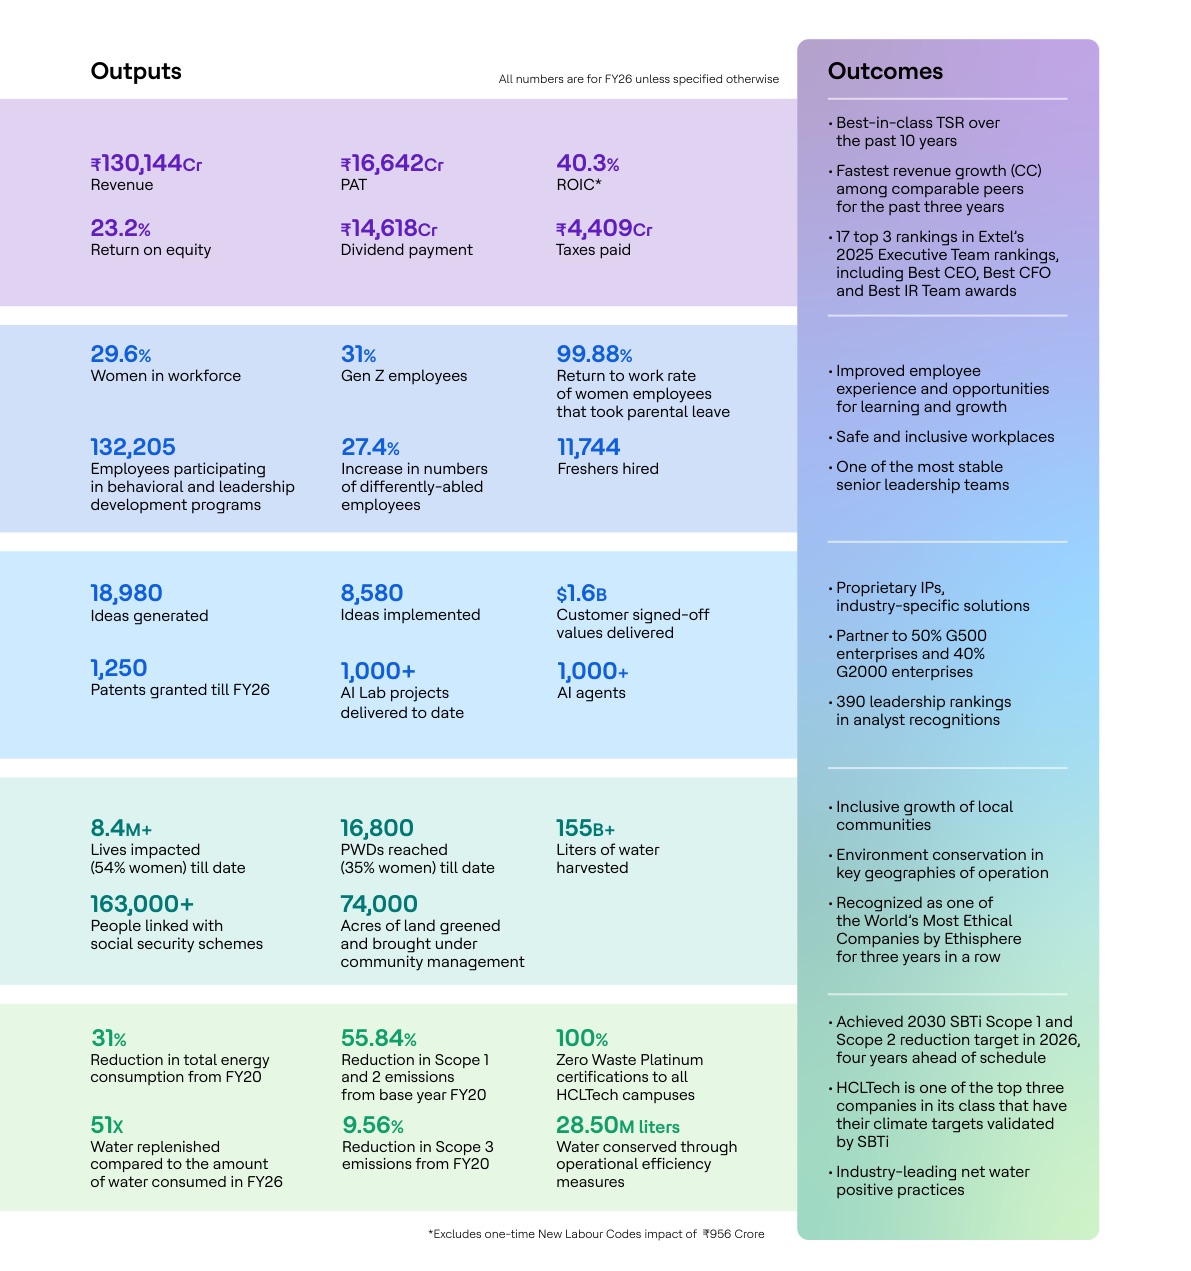
The inputs and outputs on pages 53-54 are numbers, which is the hard part. ₹74,143 crore of employee costs and 9.42 million training hours go in. 11,744 freshers hired, 31% Gen Z employees and 99.88% of women returning from parental leave come out. ₹2,014 crore of R&D goes in; 1,250 patents and 8,580 implemented ideas come out.
The outcomes column is where the model stops being evidence. Financial capital's outcomes are "best-in-class TSR" and 17 top-three rankings in an investor-relations survey. Social capital's include an Ethisphere listing. Human capital's are "improved employee experience" and "safe and inclusive workplaces". An outcome should be a measured change. Attrition (12.5%, p. 91), client retention or emissions intensity would all do, and the report has those numbers elsewhere.
The model also misses the year's biggest people decision. HCLTech booked ₹850 crore of one-time restructuring cost in employee expenses, which cut the EBIT margin by 65 basis points (pp. 80 and 114). The MD&A says the programme gave it "structural agility" for the AI era (p. 94). The human capital chapter (pp. 58-61) doesn't mention it. It doesn't say who was affected or how many people. An integrated report is the place to put the cost of reshaping the workforce next to the 144,000 people retrained.
Environment: a target met, a target slipping
- Water / p. 77834,013 → 925,715 KL
About 11.0% higher. The natural capital page describes this as “down”.
- Water / BRSR p. 269820,406 → 811,018 KL
About 1.1% lower. The review finds no explanation for the difference between the two water series.
- Scope 3 / BRSR p. 269269,567 → 314,411 tCO2e
Up 16.6% year on year. The integrated section gives progress against FY20 without discussing this rise.
Source — HCLTech Integrated Annual Report 2025–26, pp. 54, 77 and 269, as cited in this review. Read each series on its stated basis. The review does not resolve the water discrepancy.
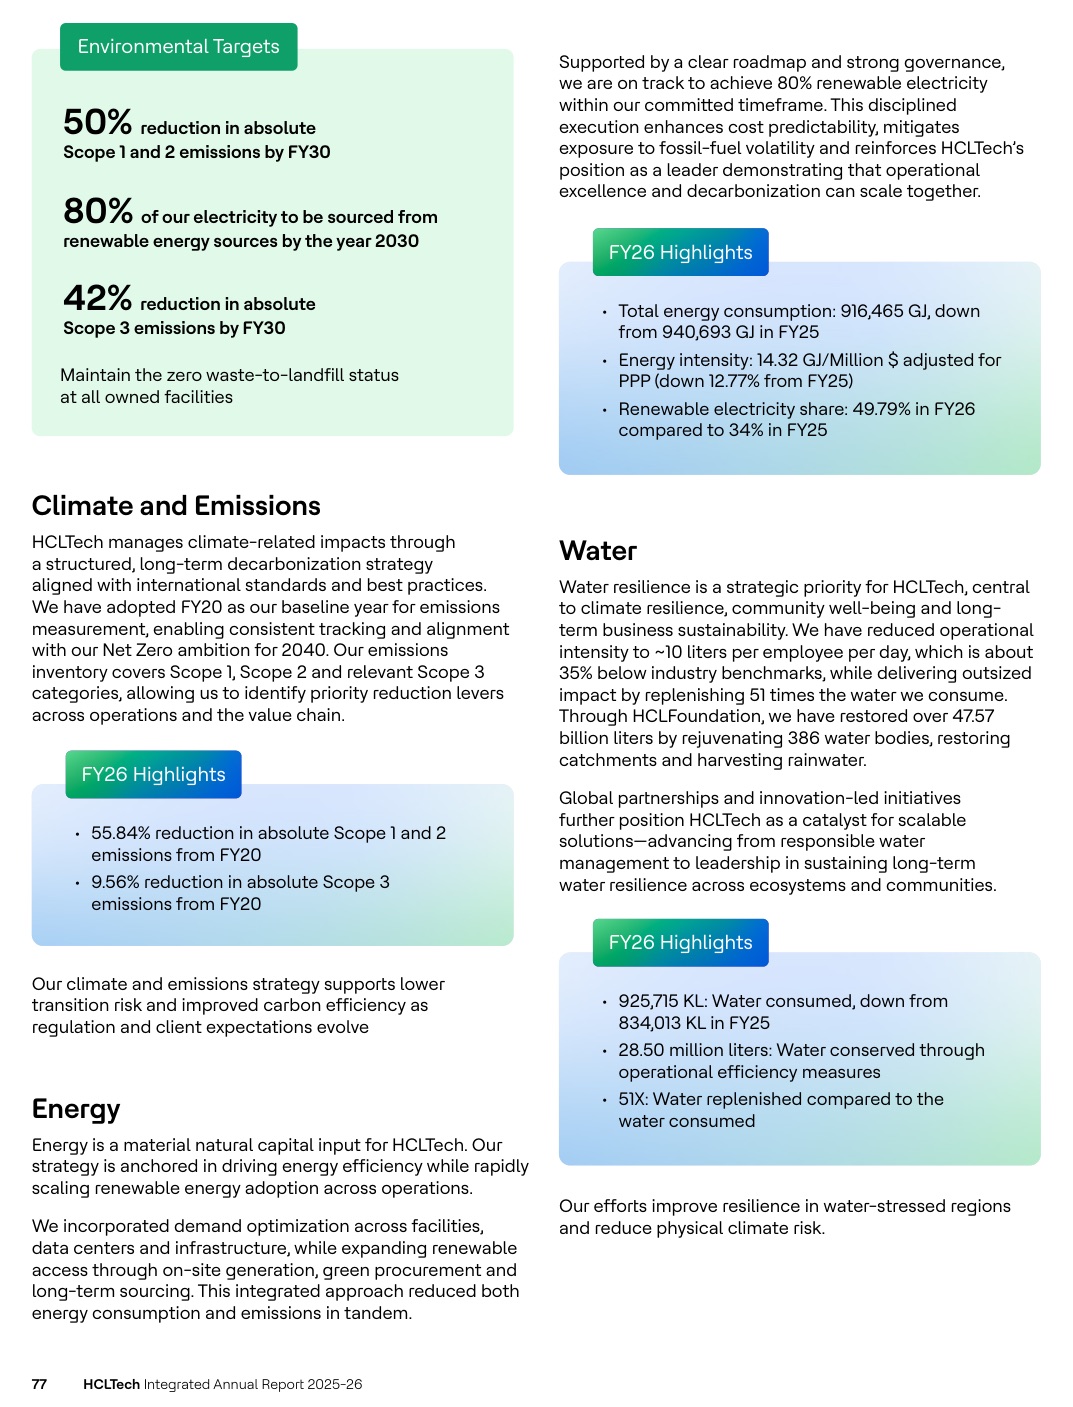
The good news is real. HCLTech's SBTi target was a 50% cut in absolute Scope 1 and 2 emissions by FY30 from FY20. It reports 55.84%, four years early (p. 77). The double materiality assessment behind the material topics is dated, conducted in FY26 (p. 56), which most Indian reports don't do. DNV gives reasonable assurance on BRSR Core, with a global boundary for most indicators (statement dated 26 June 2026, p. 282).
The rest of the page needs reading with care.
- Water. The highlight box says water consumed was 925,715 KL, "down from 834,013 KL in FY25". That is an 11% rise. The BRSR, which also reports on a consolidated basis, gives 811,018 KL for FY26 against 820,406 KL for FY25 (p. 269), a 1.1% fall. Neither page explains why the two sets of numbers differ.
- Scope 3. The target is a 42% absolute cut by FY30. The integrated section reports 9.56% so far (pp. 54 and 77), with four years left. What it doesn't say is that Scope 3 rose sharply this year. The BRSR shows 314,411 tCO2e in FY26 against 269,567 tCO2e in FY25, up 16.6% (p. 269). If the FY20 baseline hasn't changed, that implies the company was about 22% below baseline a year earlier and has lost more than half of that progress in twelve months.
- Renewables. 49.79% of electricity against an 80% target for 2030, described as "on track".
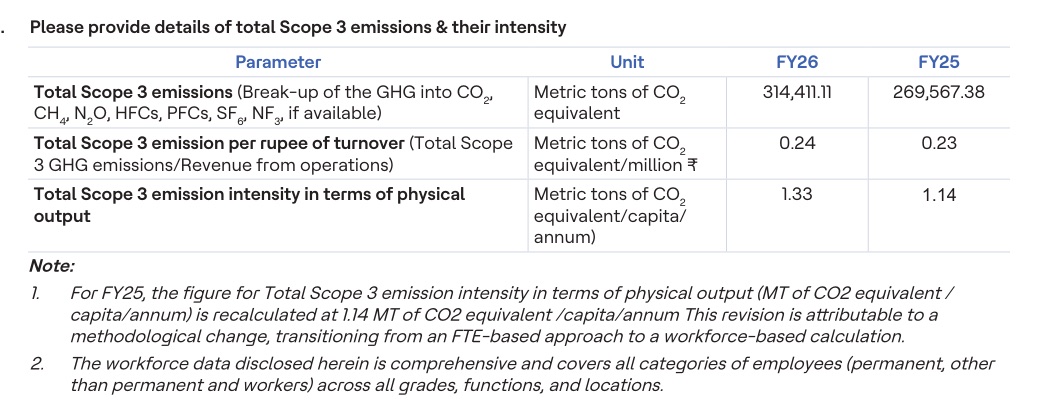
Scope 3 is now about three-quarters of HCLTech's reported footprint: 314,411 tCO2e against 98,949 tCO2e for Scope 1 and 2 combined (pp. 263 and 269). A 17% rise is the most important environmental fact in the report, and the integrated section should explain it, whether the cause is more travel, acquisitions or a change of method.
Governance: complete, but the skills grid says little
The corporate governance report covers what Schedule V requires: attendance, committee composition, remuneration and familiarisation. The Board had five women among its ten directors at year end (p. 181). The risk section (pp. 97-110) sets out each principal risk with details and mitigation, and its AI risk entry is unusually direct about the threat of clients building their own capability and of automation reducing billable work (p. 98).
The skills matrix is a grid, which is better than prose, but it doesn't tell a reader much (pp. 184-185). Every director is ticked for leadership, strategy, governance, finance and mergers and acquisitions. It has no row for AI, cybersecurity or sustainability, the three areas the strategy and risk sections spend most time on. Board evaluation is described as a process with criteria, and no findings or changes are reported (p. 128).
Design and the digital version
The design is clean and consistent: single portrait pages rather than spreads, which read well on a phone, one accent colour per capital, and charts with values labelled directly. The two problems are pacing and weight. Five pages of awards (pp. 13-17) and 34 pages of business-line case studies (pp. 18-51) come before the value creation model. And outside the value creation section, much of the content is promotional.
The online edition at hcltech.com breaks the report into navigable web sections, and the contents page links to the separate Sustainability Report FY26. The PDF is weaker. The contents page has no clickable links to its sections, the file is not marked as a tagged PDF for screen readers, and the bookmarks carry internal file names ("02 HCL Tech AR_2025-26_CGR_DNV", a section called simply "2"). Three bookmarks, for an AGM notice and its annexures that are not in this file, open the cover.
What other companies can copy
- Put the falling number on the highlights page, with its arrow (p. 9). Statutory profit down 4.3%, shown as down, next to the adjusted figure and its label.
- Chart total shareholder return for every period from one to ten years (p. 95). Printing the bad short-term years makes the good long-term number credible.
- Name the guidance miss in the CEO's letter (p. 5). One clause, "fractionally lower than our guidance", buys trust for the rest of the letter.
- Date the materiality assessment (p. 56). "Conducted in FY26" answers the question most reports leave open.
- Define a new metric when you introduce it (pp. 3 and 19). HCLTech says what Advanced AI includes and excludes. Next, say how "annualised" is calculated.
And what not to copy: a payout ratio that changes between the letters and the highlights page, an environmental highlight that calls a rise a fall, and a year-on-year jump in Scope 3 left for readers to find in the BRSR.
The score
- Strategy and narrative4 / 5
- Integrated thinking and capitals3 / 5
- BRSR and ESG integration3 / 5
- Governance disclosure3 / 5
- Financial storytelling4 / 5
- Design and readability4 / 5
- Digital version4 / 5
Seven criteria, each out of five. Scores assess reporting quality. The review’s reasons appear in the table below.
| Criterion | Score (of 5) | Why |
|---|---|---|
| Strategy and narrative | 4 | Five AI vectors with checkable numbers and a candid CEO letter; Advanced AI revenue needs its basis stated |
| Integrated thinking and the capitals | 3 | Numeric inputs and outputs, but outcomes are awards and adjectives, and the restructuring is missing from human capital |
| BRSR and ESG integration | 3 | Dated double materiality, Scope 1+2 target met, reasonable assurance; Scope 3 rise and water figures not reconciled |
| Governance disclosure | 3 | Complete statutory disclosure and a direct AI risk entry; skills matrix ticks every box and has no AI or ESG row |
| Financial storytelling | 4 | Falling profit and negative TSR printed up front; three payout ratios and two profit growth rates unreconciled |
| Design and readability | 4 | Clean single-page layout and good charts; long run of awards and case studies before the value creation section |
| Digital version | 4 | Sectioned online edition and phone-friendly PDF; untagged PDF, unlinked contents and file-name bookmarks |
| Total | 25 / 35 |
How it compares
Every review on The Footnotes uses the same seven-point card, so scores can be compared. Scores are editorial opinion of the published document.
| Company | Score (of 35) |
|---|---|
| Hindustan Zinc | 30 |
| HUL | 28 |
| TCS | 28 |
| Bharti Airtel | 27 |
| L&T | 27 |
| Reliance | 27 |
| HDFC Bank | 26 |
| Asian Paints | 25 |
| HCLTech (this review) | 25 |
| ICICI Bank | 25 |
| Infosys | 25 |
| LTM | 25 |
| Tata Steel | 25 |
| Mahindra & Mahindra | 24 |
| Titan | 23 |
| Adani Ports | 22 |
| ITC | 21 |
| SBI | 21 |
| Sun Pharma | 21 |
| Bajaj Finance | 20 |
| NTPC | 20 |
Frequently asked questions
How long is HCLTech's annual report and how is it organised?
The PDF on HCLTech's investor relations site is 462 pages. Printed page numbers run from the Chairperson's message on page 1. The corporate overview and business sections run to page 51, the value creation section (value creation model, strategy and the five capitals) from page 52 to page 78, the MD&A from page 79, the Directors' Report from page 126, the corporate governance report from page 181, the BRSR from page 208 and the financial statements from page 285. A separate Sustainability Report FY26, prepared under the GRI Standards, is linked from the contents page.
What is HCLTech's Advanced AI revenue?
HCLTech reports Advanced AI as a category covering AI Factory, Physical AI, Robotics, AI Engineering and Custom Silicon, separate from classical AI and the use of AI in traditional services. It reported annualised Advanced AI revenue of US$620 million as of 31 March 2026 (pp. 3 and 19). The report does not say how the annualised figure is derived.
How much of its profit did HCLTech pay out as dividends in FY26?
It depends on the page. The Chairperson's and CEO's letters say 97.6% of net income, based on a total of ₹60 a share: three interim dividends of ₹12 paid during the year and ₹24 declared on 21 April 2026. The highlights page and the MD&A say 87.8%, which is the ₹14,618 crore of dividends actually paid in FY26 divided by profit of ₹16,642 crore. The financial capital page says 89.9% cumulatively since FY22. The Board has extended its policy of paying out at least 75% of net income cumulatively to FY31 (p. 57).
What are HCLTech's climate targets and is it on track?
Its targets are a 50% cut in absolute Scope 1 and 2 emissions by FY30, a 42% cut in absolute Scope 3 emissions by FY30, both from an FY20 base, and 80% renewable electricity by 2030 (p. 77). At FY26 it reports a 55.84% cut in Scope 1 and 2 (target met early), a 9.56% cut in Scope 3 and 49.79% renewable electricity. The BRSR shows Scope 3 emissions of 314,411 tCO2e in FY26, up from 269,567 tCO2e in FY25 (p. 269).
Who assures HCLTech's BRSR?
DNV Business Assurance India Private Limited gives reasonable assurance on the BRSR Core indicators and limited assurance on the other BRSR disclosures, with a global boundary except for two Core attributes covered for India locations only. The assurance statement is dated 26 June 2026 (p. 282). B S R & Co. LLP audits the financial statements.
How does The Footnotes score annual reports?
Seven criteria, each scored 1 to 5 with a one-line reason: strategy and narrative; integrated thinking and capitals; BRSR and ESG integration; governance disclosure; financial storytelling; design and readability; and the digital version. Scores are editorial opinion based on the published document, and the same card is used for every company so results can be compared.
Sources
- HCLTech — Integrated Annual Report 2025-26 (PDF) — HCL Technologies Limited
- HCLTech Annual Report 2025-26 (online edition) — HCL Technologies Limited
- Integrated Reporting Framework (IFRS Foundation) — IFRS Foundation
- SEBI circular: BRSR Core — framework for assurance and ESG disclosures for value chain (12 July 2023) — SEBI