

State Bank of India Annual Report 2025-26: A Review
SBI's 592-page PDF is two documents in one file: a 423-page annual report that never mentions the capitals, and a 328-page Sustainability Report that carries the value creation model, the materiality matrix, the BRSR and the assurance. The numbers are strong and the ten-year table is honest, but the margin miss, the doubling of Scope 1 emissions and a board short of independent directors all sit where few readers will look.
 In short
Key takeaways
- The PDF runs to 592 pages: the Annual Report 2025-26 (423 numbered pages: a 40-page front section, a 113-page Directors' Report, the corporate governance report, standalone and consolidated statements, Pillar 3 and the Notice) followed by the Sustainability Report FY 2025-26 (328 pages in spreads), which contains the BRSR, the assurance statements and a GRI index.
- The annual report does not call itself integrated and never mentions the capitals. The Sustainability Report is prepared 'in accordance with' GRI 2021, draws on the Integrated Reporting Framework among others, has a six-capital value creation model, and states that it was reviewed and approved by the Board.
- Green advances more than doubled to ₹1,18,723 crore, or 2.83% of domestic gross advances against a year target of 2.51% and a 2030 target of 7.5%. SBI is a PCAF signatory but is still 'in the process' of calculating financed emissions, while it prints 87.1 million tCO2e of emissions avoided through financing.
- Scope 1 and 2 emissions fell 2.3% to 6,90,156 tCO2e, but Scope 1 more than doubled, from 49,583 to 1,12,866 tCO2e, driven by air-conditioner refrigerants and diesel generators, with no explanation. Scope 3 covers only business travel and waste.
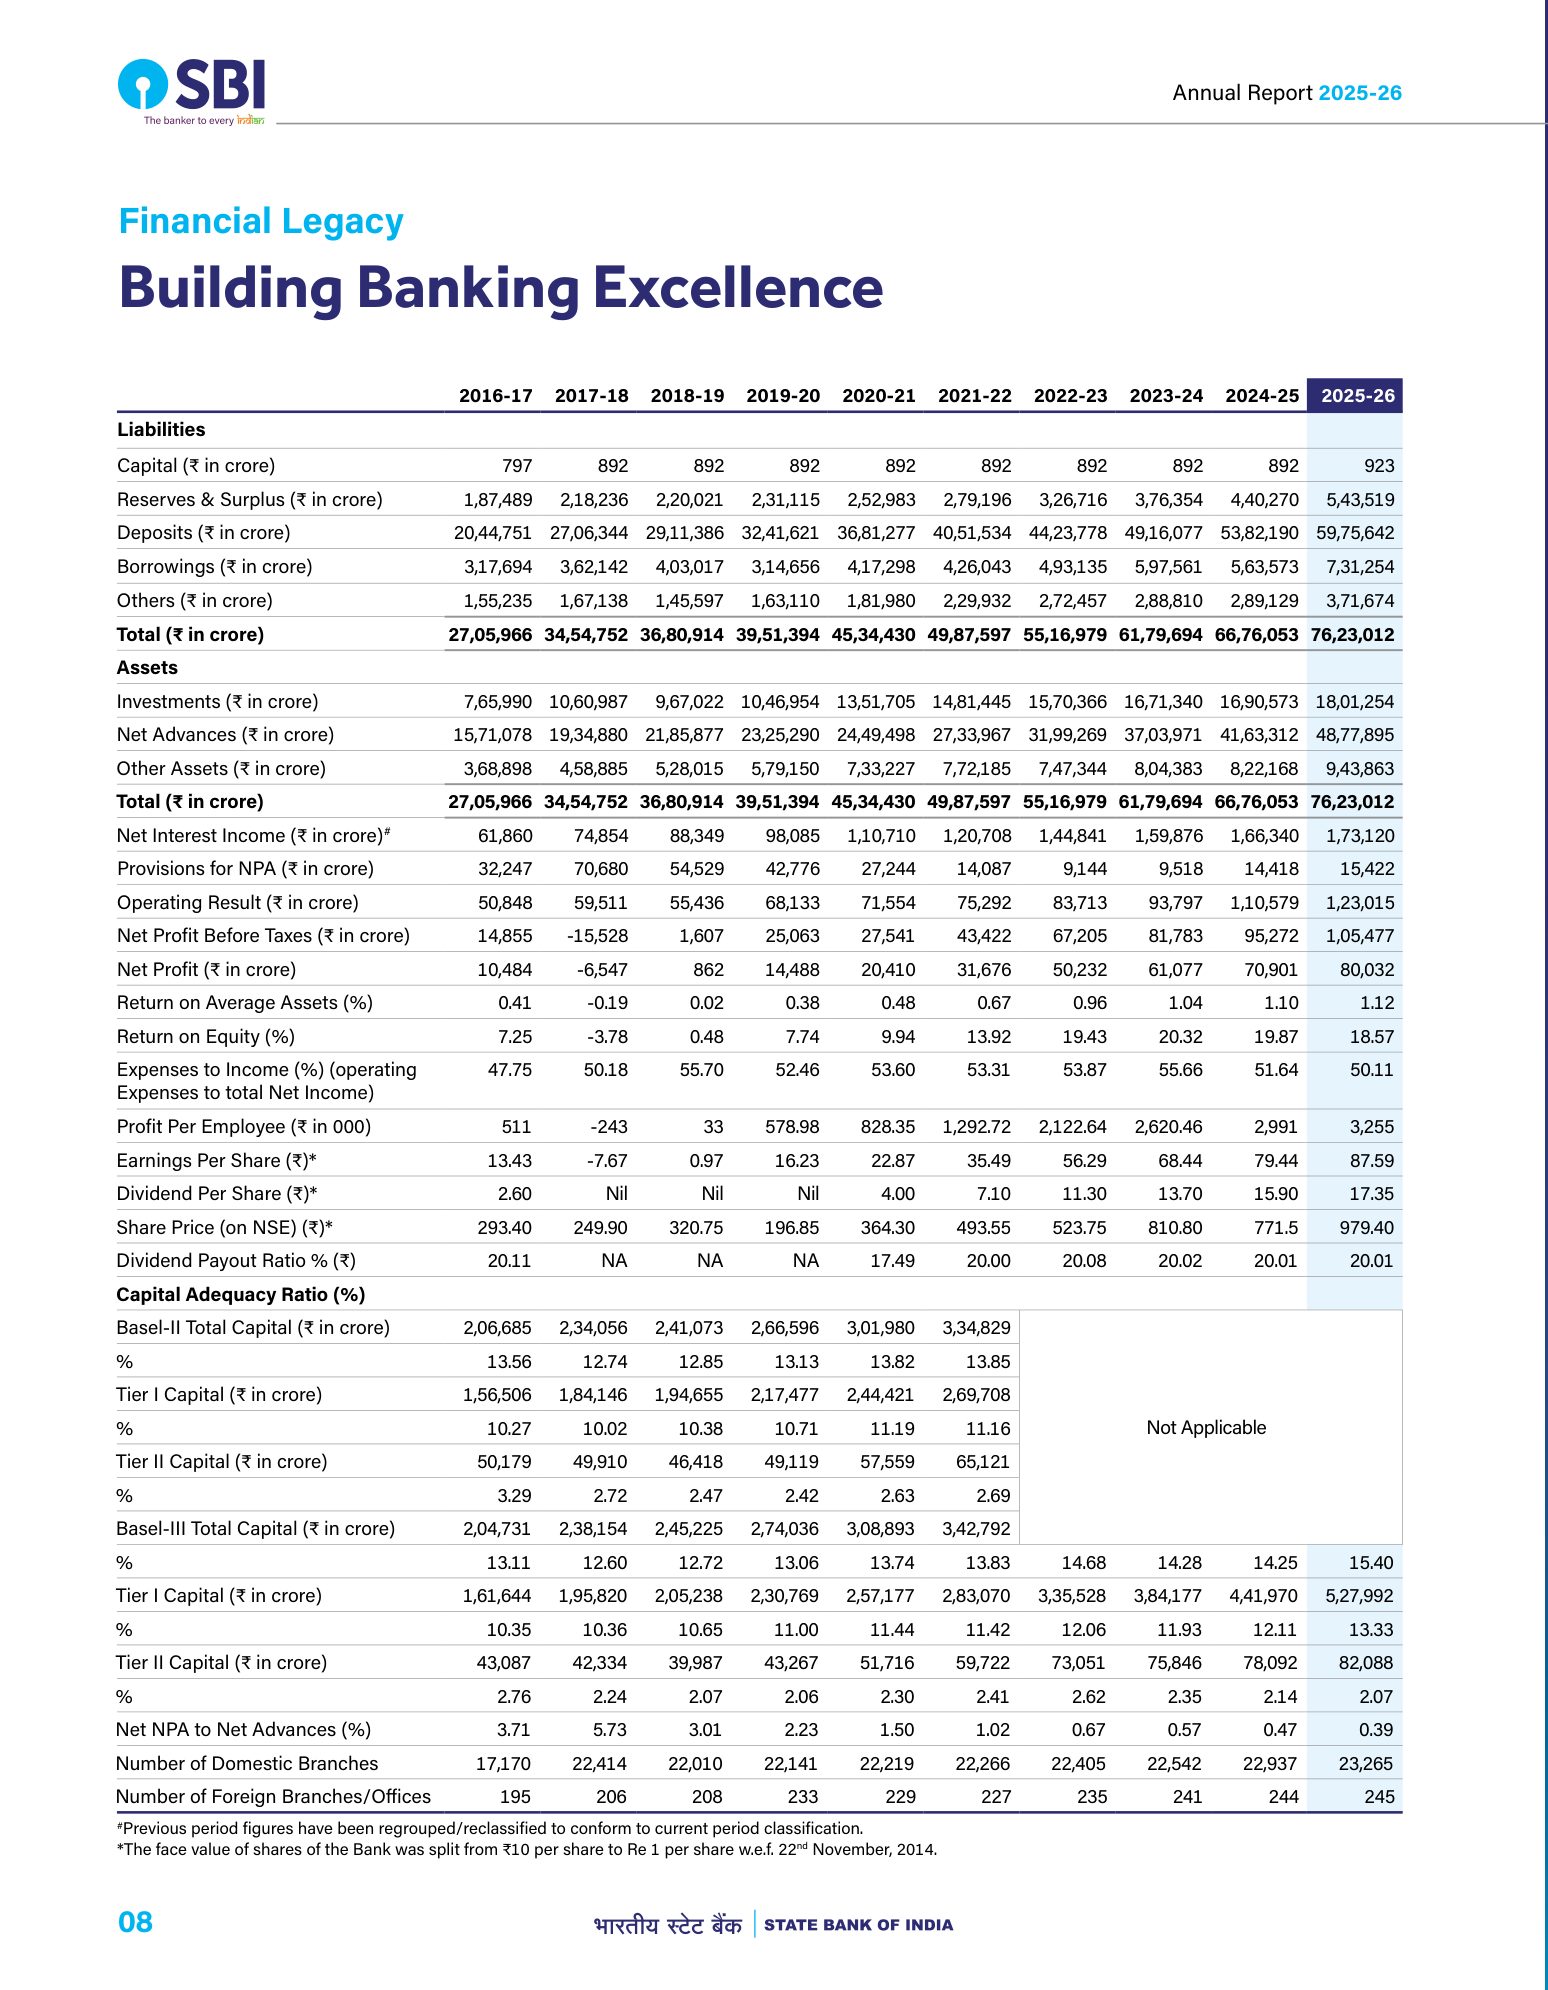
- Net profit rose 12.88% to ₹80,032 crore and the ten-year table includes the FY2018 loss. Net interest income grew 4.08% against 17.16% loan growth; the fall in net interest margin from 3.08% to 2.91%, against a target of 3.35%, appears only in the notes to accounts and a Sustainability Report materiality table.
- The secretarial auditor and the corporate governance certificate both record that the Board did not have the required half of independent directors (five of twelve). The highest sustainability body is an executive committee, with climate risk reported to the Board's Risk Management Committee, and the Sustainability Report carries a visible 'refer to page number X'.
State Bank of India had the kind of year a Chairman enjoys writing about. Net profit rose 12.88% to ₹80,032 crore, the balance sheet crossed ₹76 lakh crore, gross NPA fell to 1.49%, and a ₹25,000 crore QIP, which the report calls the largest in the history of the Indian capital market, took the CET-1 ratio to its highest level. The Annual Report 2025-26, themed "Digital First, Customer First, Nation Always", reports all of that plainly. What it does less well is put the harder numbers where readers will find them.
As with every review in this series, we read the published PDF against the <IR> Framework, SEBI's BRSR Core expectations and plain readability, and score it on the same seven-point card. Scores are our opinion. Screenshots are small excerpts reproduced for review and remain the copyright of State Bank of India; the full report is on the Bank's investor relations pages, which also host the Sustainability Report as a separate file.
The scorecard
| Criterion | Score (of 5) | In one line |
|---|---|---|
| Strategy and narrative | 3 | A Chairman's letter full of numbers and named initiatives; the five-year strategy and its targets live in the Sustainability Report, and awards and an advertisement come first |
| Integrated thinking and the capitals | 3 | A six-capital value creation model with numeric inputs, outputs and outcomes, but only in the Sustainability Report; the annual report never mentions the capitals |
| BRSR and ESG integration | 3 | Green advances against target and reasonable assurance on Core; materiality last fully assessed in FY 2022-23, no financed emissions, and Scope 1 doubled without comment |
| Governance disclosure | 3 | Committee membership on two pages and a Board-approved sustainability report; five of twelve directors independent, certified as non-compliant, and ESG reaches the Board only through the Risk Committee |
| Financial storytelling | 4 | A ten-year table that keeps the loss years and a Chairman's letter with the figures; the fall in margin is left to the notes |
| Design and readability | 3 | A compact, single-page front section, but a product advertisement, awards before the Chairman, a 113-page Directors' Report and two documents in one file |
| Digital version | 2 | No online edition this year, five bookmarks with leaked file names, none for the Sustainability Report, and scanned assurance statements |
| Total | 21 / 35 |
What the report is
The file SBI publishes as its Annual Report FY2026 is two reports bound together. The first 427 PDF pages are the Annual Report 2025-26, 423 numbered pages: a front section (Company Overview, Responsible Approach and Governance, pp. 2 to 41), the Directors' Report (pp. 44 to 156), the corporate governance report (p. 157 onwards), a one-page BRSR note (p. 196), standalone and consolidated financial statements (pp. 198 to 371), Pillar 3 disclosures and the Notice. The next 165 PDF pages are the Sustainability Report FY 2025-26, SBI's eleventh, laid out as spreads with its own numbering to page 328.
That arrangement matters for two questions this review was asked to settle. The annual report does not call itself an integrated report and never uses the word "capital" in the <IR> sense. The Sustainability Report does the integrated work: it states that it is prepared in accordance with the GRI 2021 Universal Standards, presents information "in alignment with" the Integrated Reporting Framework among other frameworks, organises its chapters by the six capitals, and says its content "has been reviewed and approved by the Board of Directors". And yes, the BRSR is inside the PDF, at pages 234 to 296 of the Sustainability Report. The annual report's own BRSR page, though, says the BRSR "has been hosted on the Bank's website" and invites shareholders to write in for a copy (p. 196). The reader holding both is told to look elsewhere for something 350 pages further on.
Key number: 2.83% of domestic gross advances were green at 31 March 2026, against a year target of 2.51% and a 2030 target of 7.5%.
Strategy and narrative: 3/5
The Chairman's message (pp. 14 to 19) is the best part of the front section. After one paragraph on the economy it goes straight to the numbers: deposits up 11.03% to ₹59.76 lakh crore, CASA ratio 39.46%, advances up 16.87%, cost-to-income down to 50.11%, CET-1 at 12.29%, slippage ratio 0.54%. It names the programmes that carry the strategy, among them Project SARAL for process re-engineering, the "ABCD" deposit discipline (All Branches to Contribute to Deposits), YONO 2.0, CHAKRA for sunrise-sector financing and an MSME centre of excellence, and it reports customer satisfaction and effort scores from an external agency.
The strategy itself is in the other document. The Sustainability Report describes a rolling Strategy Document for FY 2027 to FY 2031 with four pillars (Financial Performance, Channels and Customer Experience, Internal Organisation, Human Capital and Learning), says the document compares actual FY 2025-26 results with projections, and does not print the comparison. The Chairman's aspiration for SBI to be among the world's top 10 banks by market capitalisation by 2030 appears only in his Sustainability Report letter.
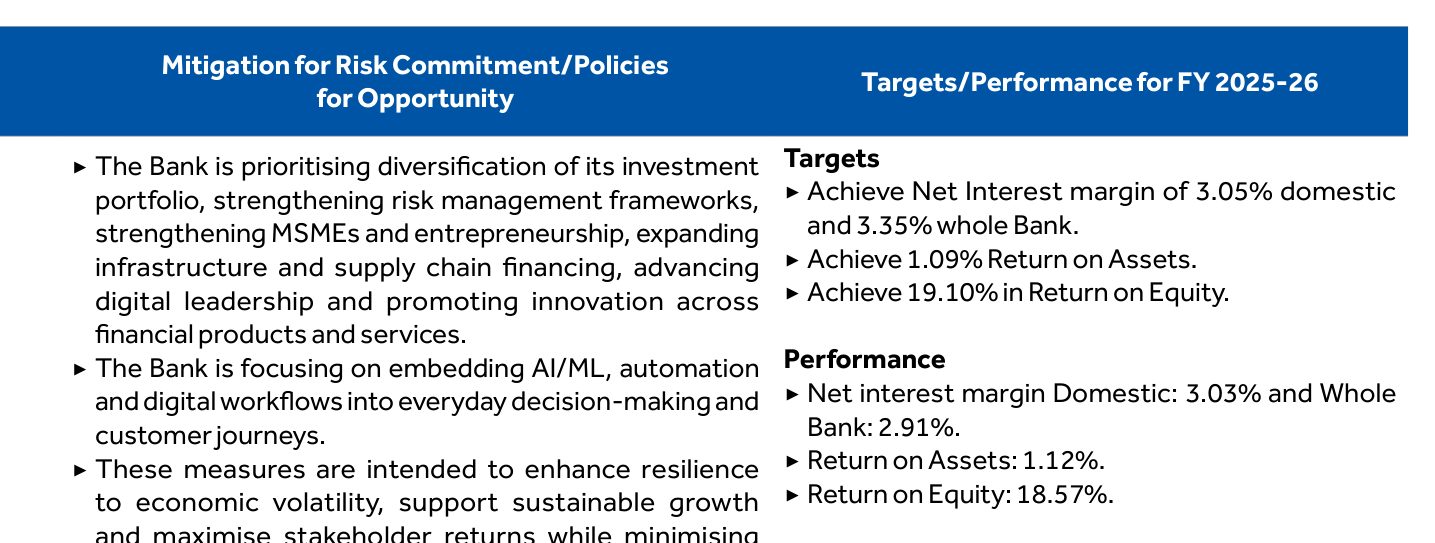
The most candid page of strategy reporting is buried in a materiality table. Under "Economic Performance" the Bank lists its FY 2025-26 targets and results side by side: a whole-Bank net interest margin of 3.35% targeted and 2.91% achieved, return on equity of 19.10% targeted and 18.57% achieved, return on assets of 1.09% targeted and 1.12% achieved. Two misses and a beat, printed without spin. That table belongs in the Chairman's letter. Instead the front section opens with a product advertisement for a savings account (p. 7) and two pages of awards (pp. 10 to 11) before the Chairman speaks.
Integrated thinking and the capitals: 3/5
The value creation model (Sustainability Report pp. 84 to 85) is a respectable piece of work. It runs from the external environment through material issues and the six capitals to inputs, value drivers, outputs and outcomes, and most rows carry numbers: deposits and CRAR for financial capital; 23,265 branches, 64,245 ATMs and ADWMs and 79,134 customer service points for manufactured capital; ₹1,169 crore of employee well-being spend and ₹22,544 of training per employee for human capital; renewable energy use of 3,67,307 GJ for natural capital. Outputs include a net interest margin of 2.91%, which the front half of the annual report never mentions.
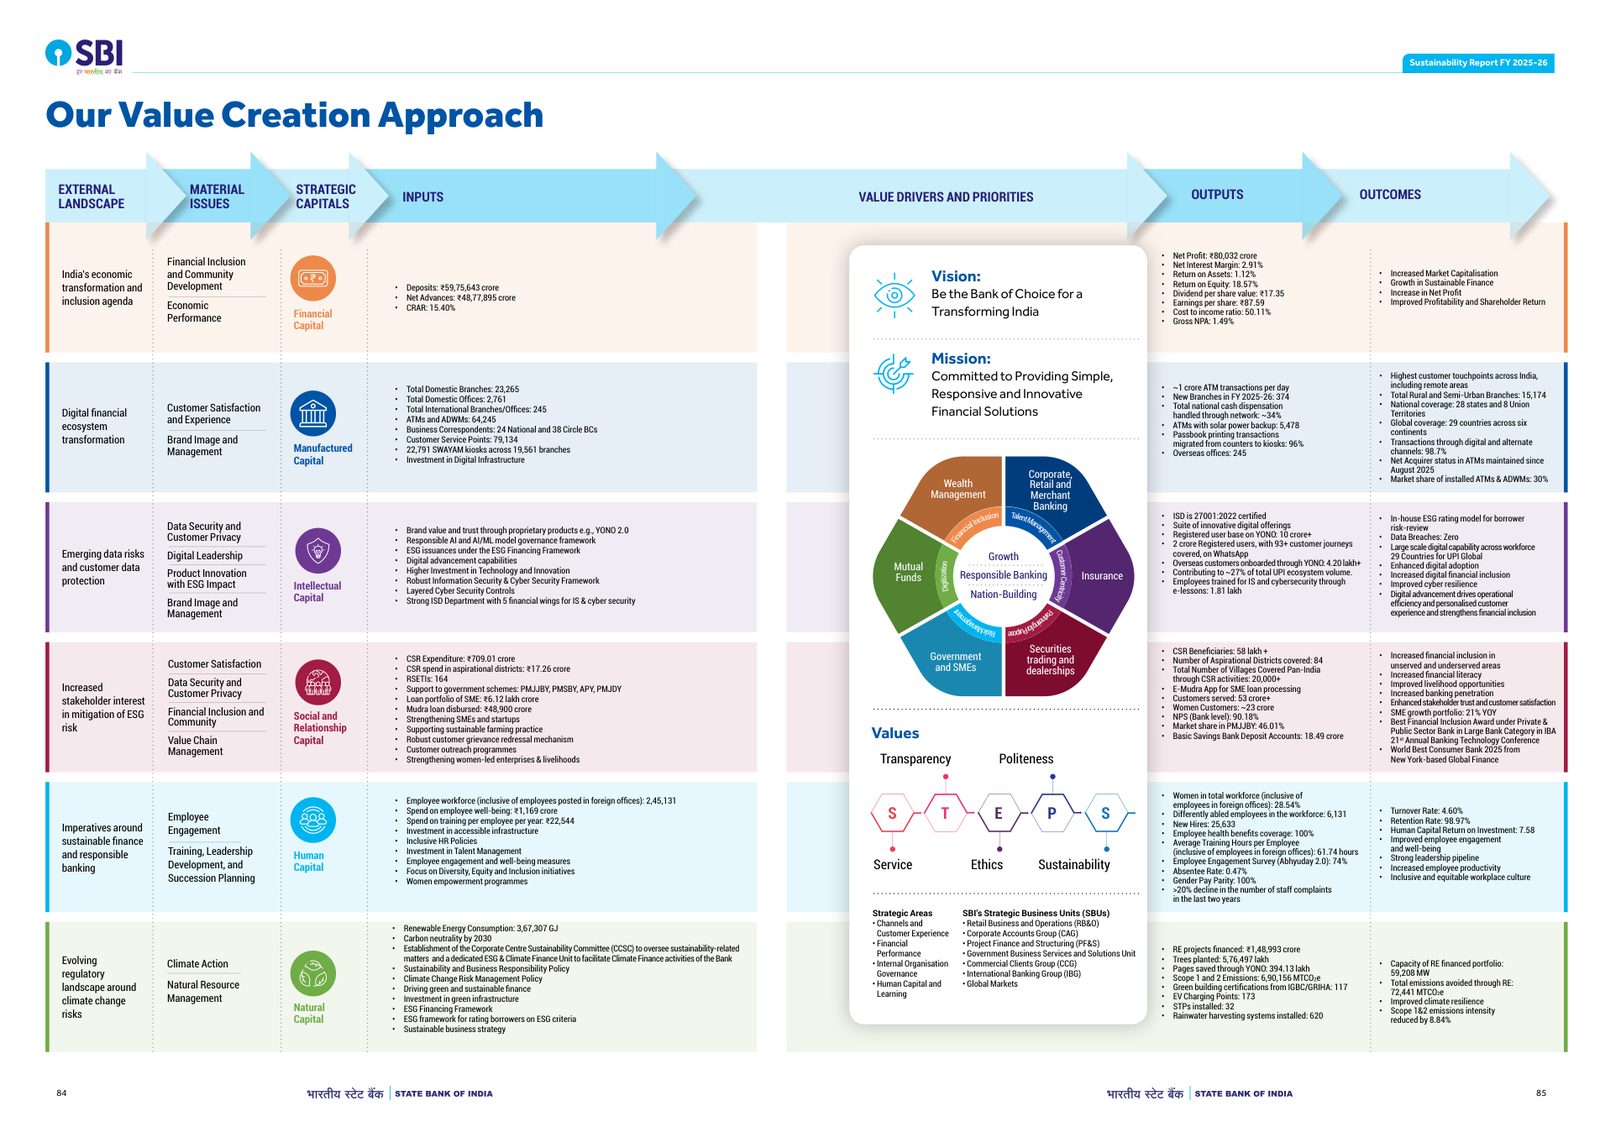
The capital chapters open with the material topics, SDGs and BRSR principles they touch, which is the right scaffolding. The weakness is the one ICICI Bank shares on our card: the outcomes column is a list of good things rather than a set of trade-offs, and the model sits in a document the annual report points away from. An integrated report would put this spread next to the Chairman's letter. SBI puts it 440 PDF pages later.
BRSR and ESG integration: 3/5
There is real content here. The green finance target is set, phased and reported: green advances more than doubled to ₹1,18,723 crore, reaching 2.83% of domestic gross advances against a calibrated year target of 2.51% and a 2030 target of 7.5%. Assurance is in order: M Bhaskara Rao and Co. gives reasonable assurance on BRSR Core under the ICAI's SSAE 3000, and Gopal Sharma and Co. gives limited assurance on selected indicators, including Scope 3. Both firms are among the Bank's statutory central auditors, and the report says so.
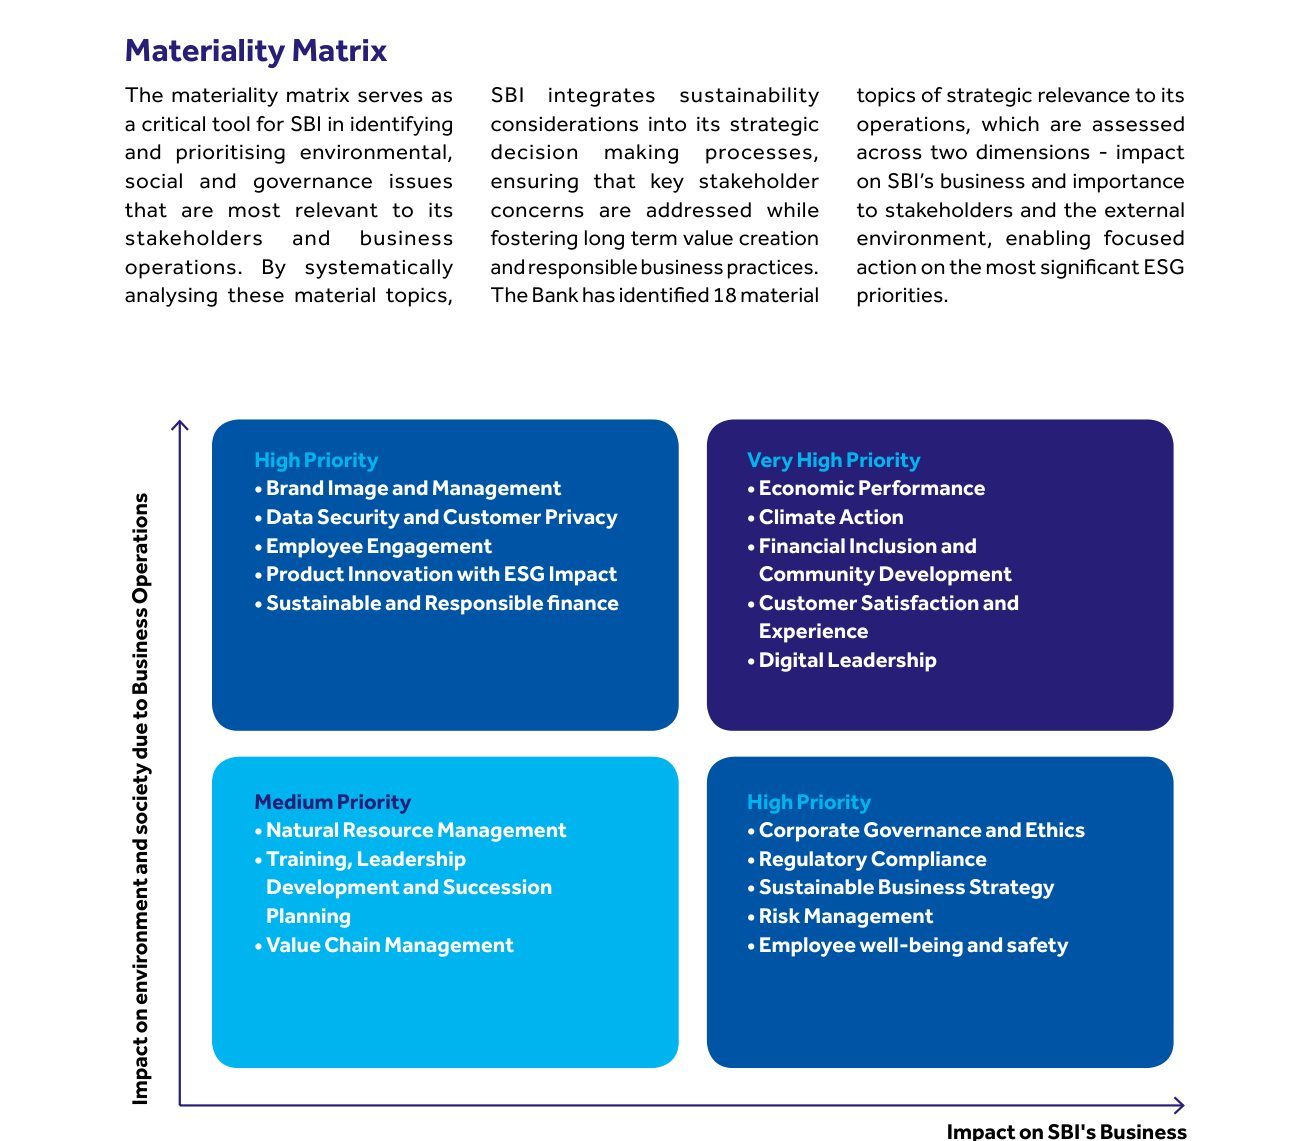
Materiality is where the gaps start. The chapter explains impact and financial materiality in terms a bank would recognise, but the underlying assessment dates from FY 2022-23, with a refresher in FY 2023-24; the "About the Report" page dates the comprehensive assessment to FY 2023-24 instead. This year three topics (sustainable and responsible finance, risk management, and employee well-being and safety) were added after leadership discussions and approved by the Corporate Centre Sustainability Committee, an executive body. The matrix sorts 18 topics into four boxes without plotting them. HDFC Bank refreshed a full double materiality assessment this year and plotted it; SBI has not.
The climate numbers need the most work.
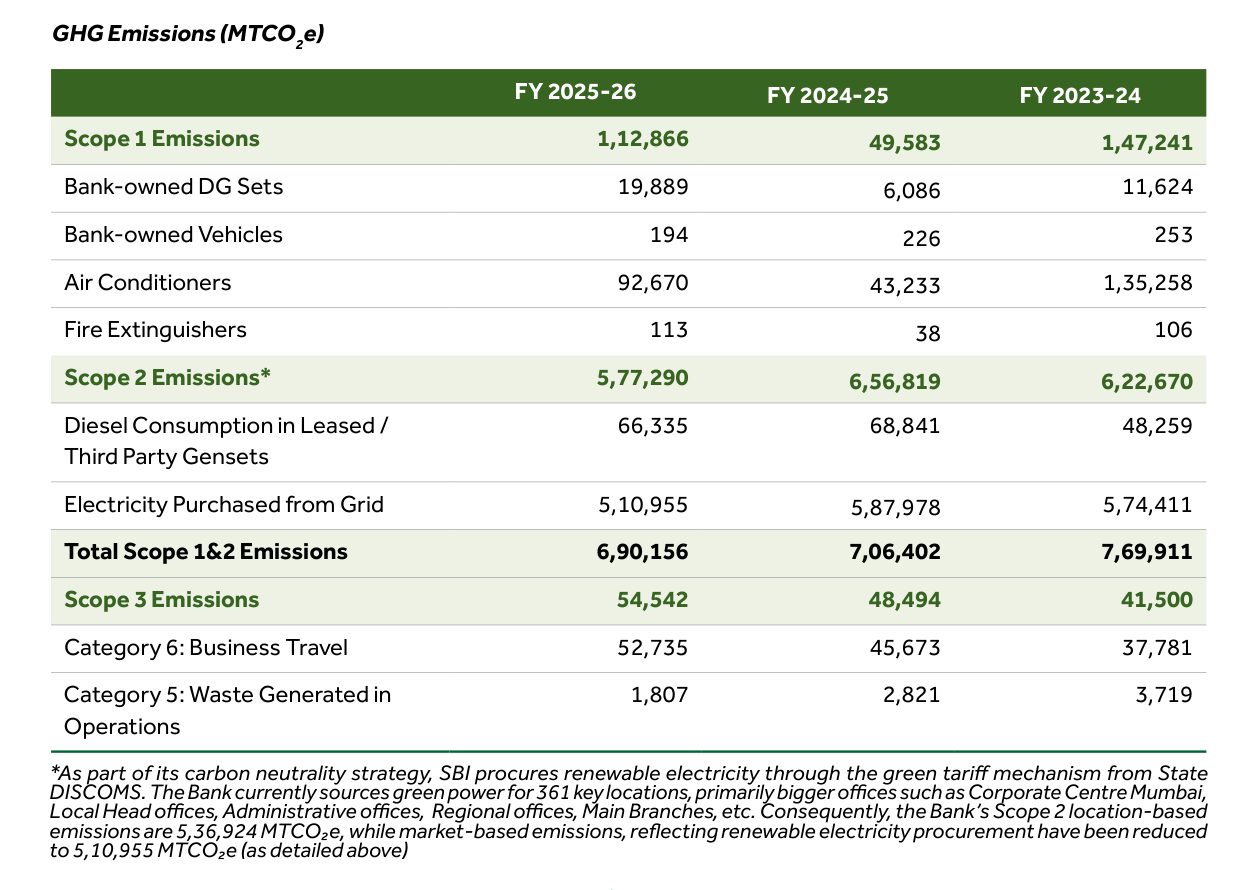
Total Scope 1 and 2 fell 2.3% to 6,90,156 tCO2e, and 10% over two years. But Scope 1 more than doubled, from 49,583 to 1,12,866 tCO2e, because refrigerant emissions from air conditioners rose from 43,233 to 92,670 tCO2e and emissions from Bank-owned diesel generators rose from 6,086 to 19,889. The report doesn't explain either movement, and the energy table two pages later shows fuel consumption by owned cars and generators falling from 10,10,160 GJ to 2,71,824 GJ in the same year, which is hard to reconcile with tripled generator emissions. The carbon neutrality roadmap uses FY 2022-23 as its base year, but the report prints no base-year figure and no year-wise targets, so a reader can't tell whether 2030 is on track. Scope 3 covers business travel and waste only.
For a bank, the missing number is financed emissions. SBI is a PCAF signatory and says it "is also in the process of calculating financed emissions". Yet the Responsible Banking chapter headlines 87.1 million tCO2e of "estimated emissions avoided through financing". Publishing the avoided emissions of the green book before the emissions of the whole book is the wrong way round. HDFC Bank, with a smaller balance sheet, reports 34.96 million tCO2e under PCAF.
Governance disclosure: 3/5
The governance pages are tidy: the Central Board, every Board committee with its chair and members, the Central Management Committee and the auditors are listed on pages 34 to 39, and the Directors' Report records the retirement of one Managing Director and the appointment of another. The Sustainability Report's governance chapter gives the independence percentage of each committee, and a Board-approval line for the Sustainability Report is more than Infosys or Tata Steel offer.
The harder facts are in the auditors' words. The secretarial auditor reports non-compliance on the appointment of directors under Sections 19(ca), 19(cb) and 19(d) of the SBI Act and with Regulation 17(1)(b) of the LODR (p. 191), and the corporate governance certificate confirms that the Bank "did not have at least half of the Board of Directors as Independent Director" (p. 195). The Board has twelve members, five independent and one woman. Appointments are the Government's to make, and the governance report says the Board complies with Regulation 17(1) except where it conflicts with the SBI Act and directives from the RBI or the Government. That is a reason, but the report should say it next to the finding. The same secretarial audit records an RBI penalty of ₹1.73 crore for non-compliance with directions on loans and advances, customer liability in unauthorised electronic transactions, and current account opening.
Sustainability governance sits mostly below the Board. The "highest governance body on Sustainability" is the Corporate Centre Sustainability Committee, chaired by the Deputy Managing Director who is Chief Credit Officer and Chief Sustainability Officer, and it approved this year's new material topics. The Board sees climate risk and quarterly sustainability performance through the Risk Management Committee of the Board, which is a reasonable route for a bank, but there is no Board committee for sustainability as such, and the CSR committee is chaired by a Managing Director.
Financial storytelling: 4/5
The "Financial Legacy" page (p. 8) is a proper ten-year table: balance sheet, net interest income, NPA provisions, operating result, profit before and after tax, RoA, RoE, cost-to-income, EPS, dividend, share price and capital ratios from FY 2016-17. It keeps the loss of ₹6,547 crore in FY 2017-18 and the ₹862 crore profit of the year after. Few banks put their bad years this close to the front.
The Directors' Report's financial performance page (p. 46) is clear and complete: net interest income up 4.08%, other income up 17.87%, operating expenses up 4.64%, provisions up 8.33% including a jump in standard asset provisions from ₹303 crore to ₹1,608 crore. What it doesn't do is explain why net interest income grew at a quarter of the rate of loans. The answer, a net interest margin down from 3.08% to 2.91%, is in the business ratios in the notes (p. 266) and in the Sustainability Report table above, and nowhere in the Chairman's letter. The Management Discussion and Analysis under Regulation 34 is a cross-reference and a table of ratio changes that reads "Nil". The table is honest; the narrative leaves out the year's main pressure point.
Design and readability: 3/5
The front section is short, on single pages, with a tab bar that tells the reader where they are, and the Chairman's letter reads well. After that the report is long in the way public sector annual reports tend to be: the Directors' Report runs department by department for 113 pages, including an official language section and a page of launch photographs. Small errors slip through: "Total CSE expenditure" for CSR on page 26, and a customer effort score of "6.74% (Out of 7)" on page 23. The Sustainability Report is denser, laid out as spreads and more consistently designed, but it has its own slips.
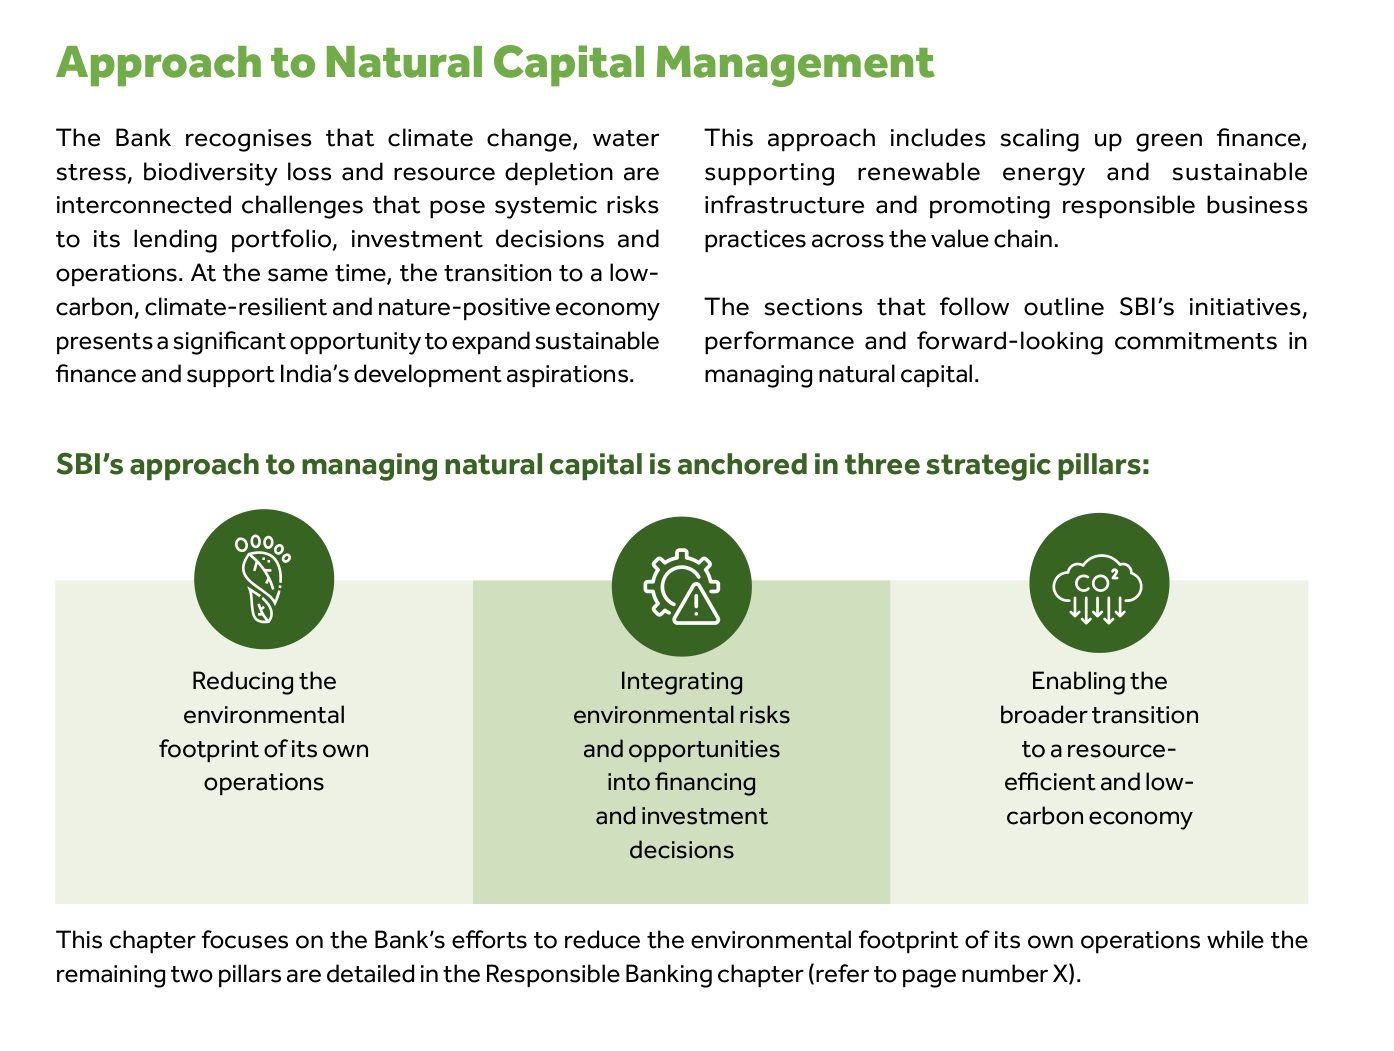
The natural capital chapter tells the reader to "refer to page number X" (p. 142), and a malformed figure reports solar electricity of "5,77,38 MWh" (p. 145). Binding two documents with two page sizes and two numbering systems into one file, with no divider, makes page references ambiguous throughout.
Digital version: 2/5
SBI published an interactive online edition for 2024-25, which is still live at sbi.bank.in/corporate/SBIAR2425/. We could find none for 2025-26: the equivalent address returns a 404, and the investor page offers the annual report and the Sustainability Report as PDFs only. The back cover carries a QR code captioned "Scan QR Code to Download".
The PDF has a text layer, but little else to help. There are five top-level bookmarks, and they carry internal file names ("SBI AR 2026_26.05.2026.pdf", "4_SBI_Financial part - Scope of Application") and stray Word and Excel anchors such as "_Hlk38567950" and "RANGE!A3:B10". There is no bookmark at all for the 165 pages of the Sustainability Report, the contents pages are not hyperlinked, and the reasonable and limited assurance statements are scanned images with no text, so a screen reader or a search for "reasonable assurance" finds nothing. The text layer of one Sustainability Report page also carries two invisible "XX" placeholders beside the key performance highlights (p. 29).
What reporting teams can take from it
Copy the ten-year table with its loss years. Copy the green advances disclosure, which sets a long-term target, breaks it into a year target and reports both. Copy the materiality table that prints targets and performance side by side, misses included.
Then move that table into the Chairman's letter and say why the margin fell. Explain the Scope 1 increase, print the carbon neutrality baseline and the year-wise path, and publish financed emissions before avoided emissions. Give sustainability a Board committee of its own, or at least have the Board approve the material topics. Either integrate the two documents or keep them apart, and if they stay in one file, give the Sustainability Report a bookmark, fix the annual report's statement that the BRSR is on the website, and run a search for "X" before release.
Series scorecard
Every report in this series is scored on the same seven-point card by the same reader. Scores are editorial opinion of the published document; each review carries the page references behind its findings.
| Company | Score (of 35) |
|---|---|
| Hindustan Zinc | 30 |
| TCS | 29 |
| HUL | 28 |
| Bharti Airtel | 27 |
| L&T | 27 |
| Reliance | 27 |
| HDFC Bank | 26 |
| Asian Paints | 25 |
| ICICI Bank | 25 |
| Infosys | 25 |
| LTM | 25 |
| Tata Steel | 25 |
| M&M | 24 |
| Titan | 23 |
| Adani Ports | 22 |
| ITC | 21 |
| SBI (this review) | 21 |
| Sun Pharma | 21 |
| Bajaj Finance | 20 |
| NTPC | 20 |
Frequently asked questions
Is SBI's Annual Report 2025-26 an integrated report?
No. The annual report does not describe itself as integrated and does not use the capitals. The Sustainability Report FY 2025-26, bound into the same PDF after the annual report, is prepared in accordance with the GRI 2021 Universal Standards and presents information in alignment with the Integrated Reporting Framework, IFC Performance Standards, UNGC principles and the SDGs. It contains a six-capital value creation model and capital chapters, and states that its content was reviewed and approved by the Board of Directors.
Does SBI's annual report include the BRSR?
The file SBI hosts as the Annual Report FY2026 does: the BRSR sits inside the bound-in Sustainability Report at pages 234 to 296 of that report, followed by the assurance statements. The annual report's own BRSR page (p. 196) says the BRSR is hosted on the Bank's website and offers a copy on request. The BRSR covers domestic operations only; the Sustainability Report covers standalone operations including 245 overseas offices.
Who assures SBI's BRSR?
M Bhaskara Rao and Co., one of the Bank's statutory central auditors, gives reasonable assurance on BRSR Core attributes under the ICAI's Standard on Sustainability Assurance Engagements 3000. Gopal Sharma and Co., also a statutory central auditor, gives limited assurance on selected non-financial disclosures, including Scope 3 emissions. Both statements are reproduced as scanned images at pages 297 to 309 of the Sustainability Report.
What are SBI's climate targets and emissions?
Carbon neutrality in internal operations (Scope 1 and 2) by 2030, net zero across Scope 1, 2 and 3 by 2055, and green advances of at least 7.5% of domestic gross advances by 2030. In FY 2025-26 Scope 1 and 2 emissions were 6,90,156 tCO2e (7,06,402 in FY 2024-25), Scope 1 was 1,12,866 tCO2e (49,583), and Scope 3, covering business travel and waste only, was 54,542 tCO2e. Green advances reached 2.83% of domestic gross advances. Financed emissions are not yet reported.
What were SBI's FY 2025-26 results?
Standalone net profit of ₹80,032 crore, up 12.88%; operating profit of ₹1,23,015 crore, up 11.25%; net interest income of ₹1,73,120 crore, up 4.08%; deposits of ₹59.76 lakh crore, up 11.03%; advances of ₹49.33 lakh crore, up 16.87%; RoA of 1.12%, RoE of 18.57%, gross NPA of 1.49% and net NPA of 0.39%; capital adequacy of 15.40% after a ₹25,000 crore QIP. The dividend is ₹17.35 per share. SBI Group net profit was ₹83,299 crore, up 7.40%.
How does The Footnotes score annual reports?
Seven criteria, each scored 1 to 5 with a one-line reason: strategy and narrative; integrated thinking and capitals; BRSR and ESG integration; governance disclosure; financial storytelling; design and readability; and the digital version. Scores are editorial opinion based on the published document, and the same card is used for every company so results can be compared.
Sources
- State Bank of India: Investor Relations, Annual Report — State Bank of India
- Integrated Reporting Framework (IFRS Foundation) — IFRS Foundation
- PCAF: The Global GHG Accounting and Reporting Standard for the Financial Industry — Partnership for Carbon Accounting Financials
- SEBI circular: BRSR Core, framework for assurance and ESG disclosures for value chain (12 July 2023) — SEBI