


Maruti Suzuki's report is full of dated targets, from seven SUVs to 85% renewable power. But it calls a year of 1% profit growth a record without explaining it, it leaves the ₹5,392 crore royalty to Suzuki in the notes, and it gives two different figures for its own capacity goal.
In this article
 In short
Key takeaways
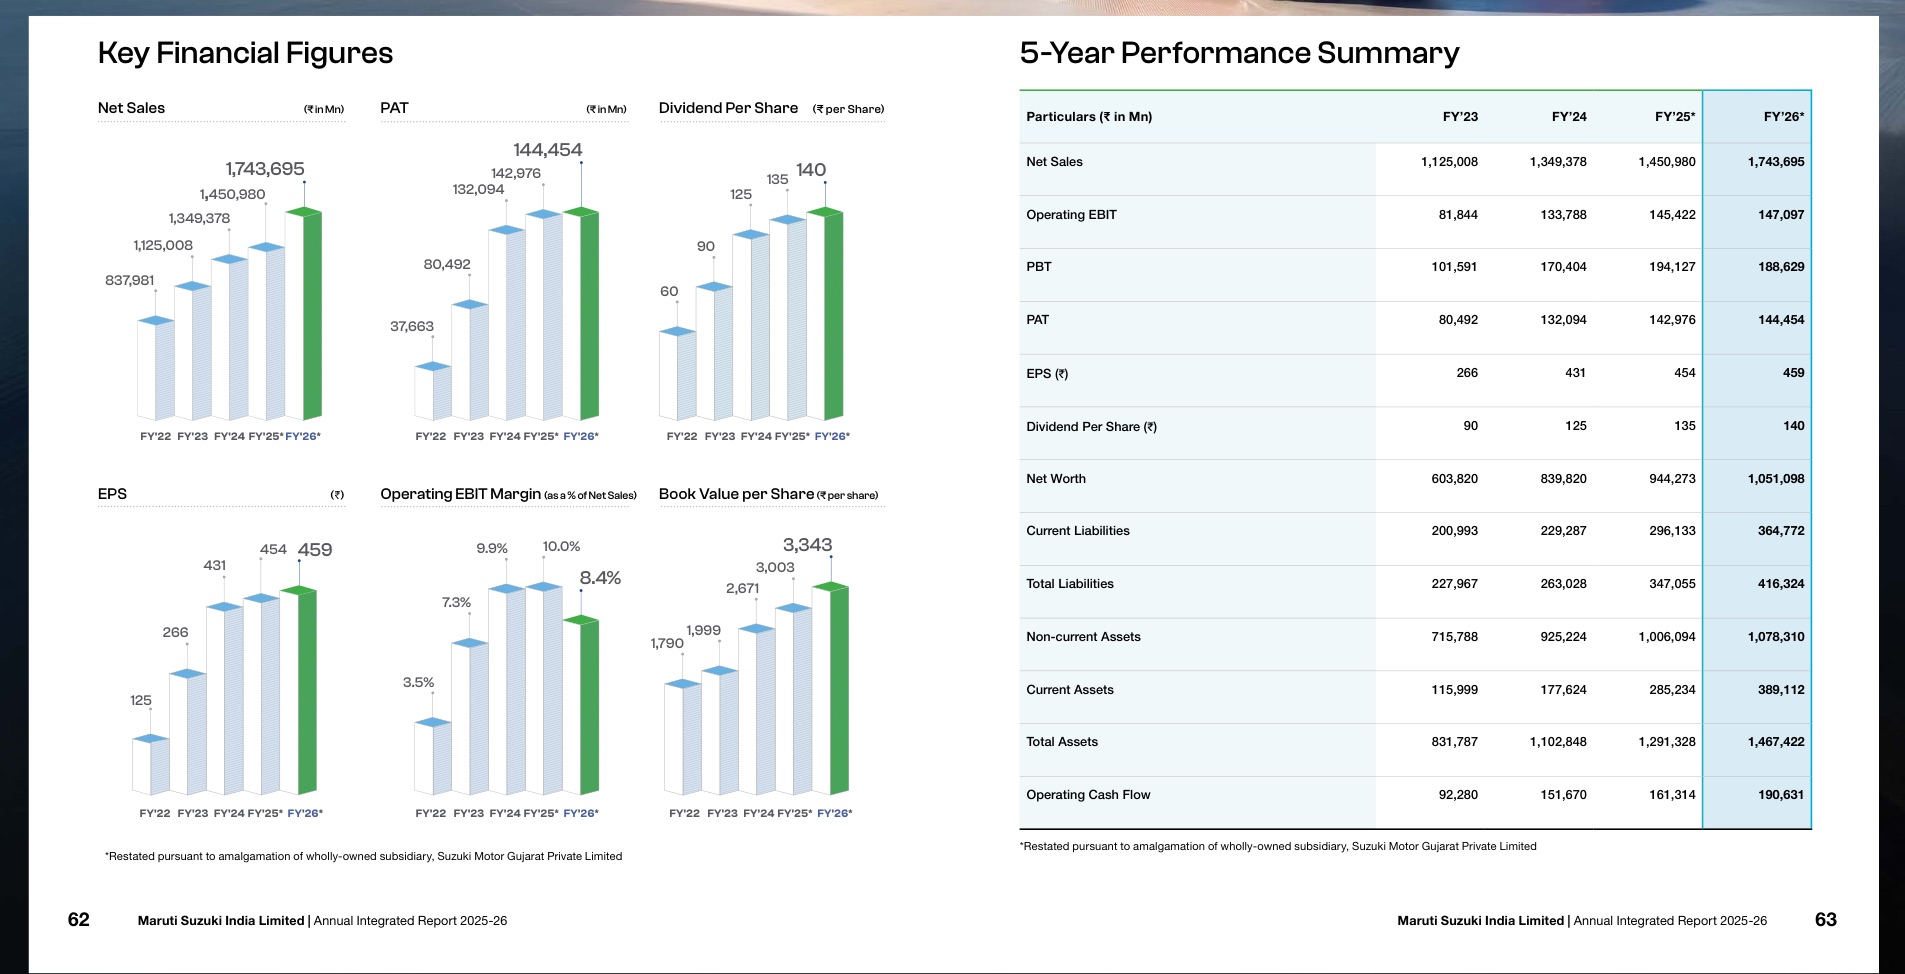
- Net sales rose 20.2% to ₹1,74,370 crore and vehicle sales reached a record 2,422,713, but profit after tax rose only 1.0% to ₹14,445 crore. Profit before tax fell 2.8%, and the operating EBIT margin fell from 10.0% to 8.4% (pp. 62-63, 291).
- The MD&A gives the reason in one paragraph: commodity prices, supply costs from the West Asia conflict, and cost increases not fully passed on to customers (p. 259). The highlights page shows only green "up" arrows (pp. 42-43).
- Royalty to Suzuki Motor Corporation was ₹5,392 crore (p. 398), equal to 37% of profit after tax and eight times Maruti's own ₹676 crore R&D spend. It appears only in the notes to the accounts, not in the value-creation model, the MD&A or the governance section.
- The Chairman says installed capacity will reach 3.65 million units by the end of FY 2030-31 (p. 46). The MD&A says the ambition is 4 million units a year by FY 2030-31 (p. 286).
- The Scope 1 and 2 target was set by the parent company (p. 70). The Chairman's goal of 266,000 tonnes by FY 2030-31 (p. 46) means a 59% cut from the 645,228 tonnes on the report's own chart (p. 133), while capacity rises by about half.
- The PDF is 510 printed pages laid out as 257 two-page spreads, with no usable bookmarks. One hyperlink in the accounts (p. 439) opens a Google search for a company registration number.
Official report: Download the Maruti Suzuki Annual Integrated Report 2025-26 (PDF). This page is The Footnotes' independent review of it.
Verdict: Maruti Suzuki tells you where it is going in more detail than most Indian companies, but is less clear about what this year cost it. The targets are dated and numbered. The fall in margin, and the ₹5,392 crore royalty paid to its Japanese parent, are left for the back half of the report. Score: 22 of 35.
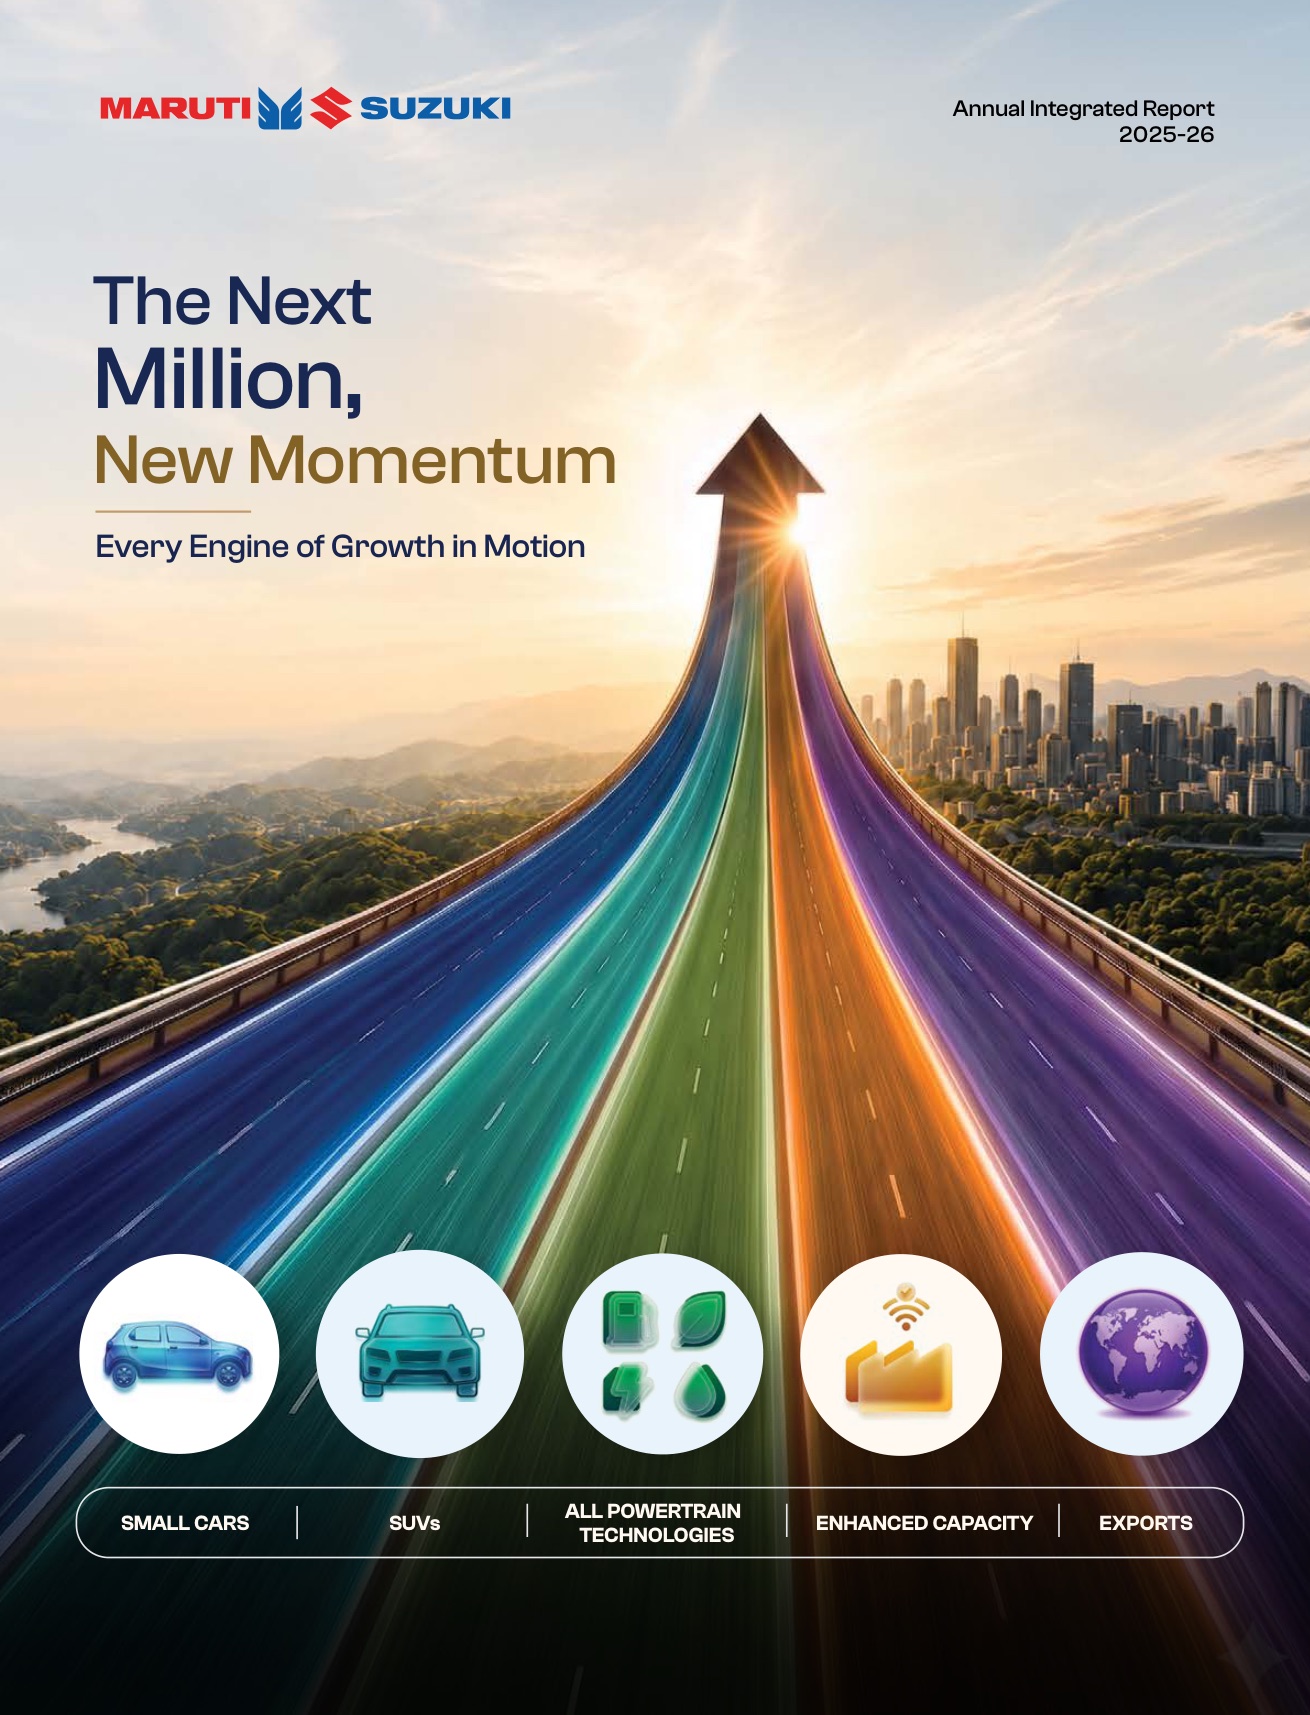
The report is called "The Next Million, New Momentum". It runs to 510 printed pages: an integrated section to page 197, then the Board's report (p. 198), the corporate governance report (p. 233), the MD&A (p. 256), the BRSR (pp. 296-343), and standalone and consolidated accounts. It covers Maruti's own operations only. Suzuki Motor Gujarat, which runs the Hansalpur plant, merged into Maruti during the year, and last year's figures are restated to include it. Joint ventures and subsidiaries are excluded (p. 5). Page numbers below are the printed ones. Screenshots are small excerpts reproduced for review and remain the copyright of Maruti Suzuki India Limited; the full report is on the company's investor pages.
A record year, and a 1% profit rise
- +20.2%Net sales
₹1,74,370 crore
- +1.0%Profit after tax
₹14,445 crore
- −2.8%Profit before tax
₹18,863 crore
Operating EBIT margin
Higher commodity and supply costs, with increases only partly passed to customers, compressed margin. Lower deferred tax helped PAT rise while PBT fell.
Source — Maruti Suzuki Annual Integrated Report 2025–26, pp. 62–63, 259 and 291, as cited in this review.
The numbers that lead the report are records. Maruti sold 2,422,713 vehicles, including a record 447,774 exports. Net sales rose 20.2% to ₹1,74,370 crore, and the ₹140 dividend is the highest ever. The Chairman calls profit of ₹14,445 crore "the highest ever" (p. 45).
That is true. It is also 1.0% more than last year, on 20% more sales.
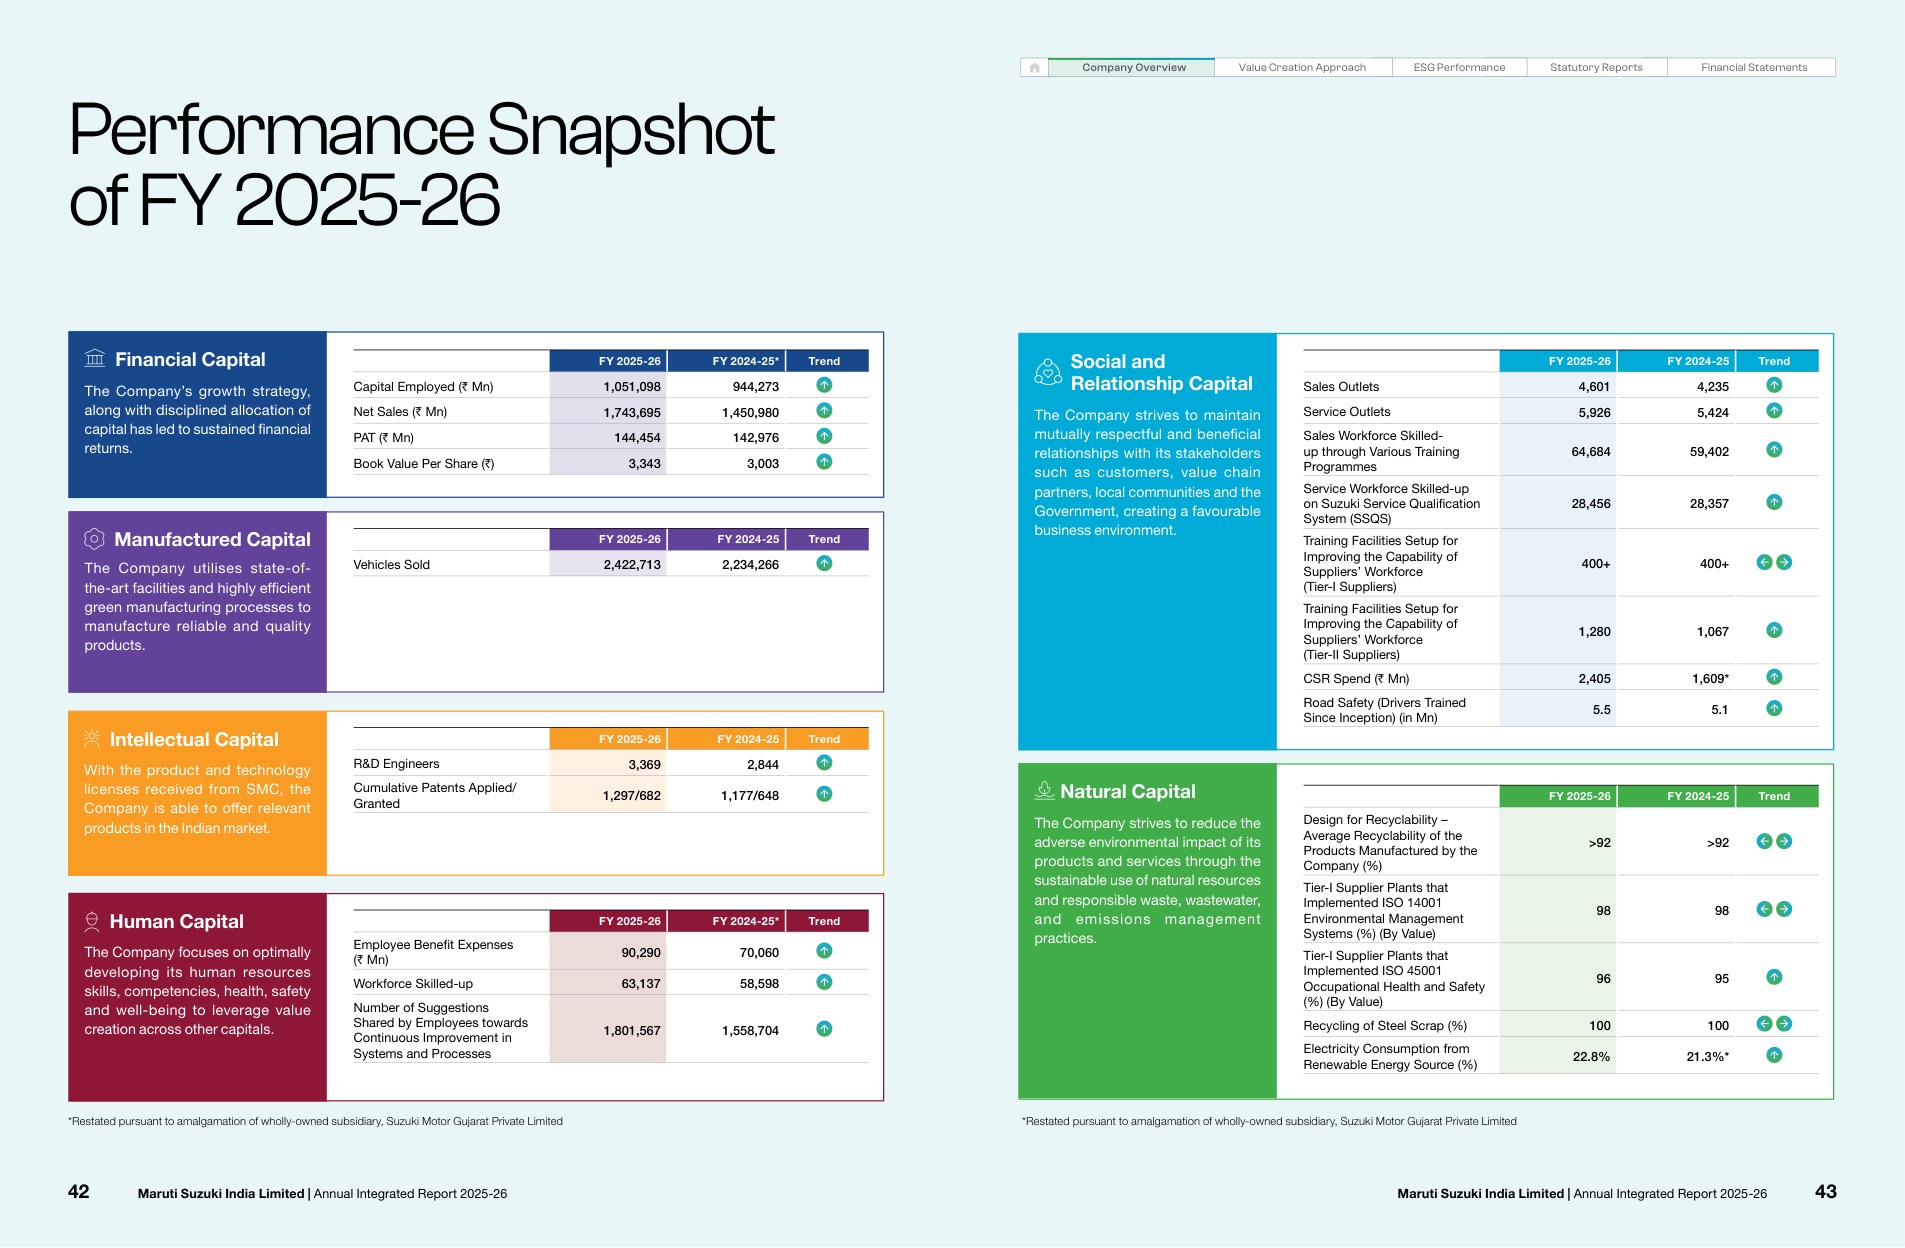
The Performance Snapshot (pp. 42-43) lists 23 metrics across the six capitals, and every one has a green arrow pointing up or sideways. Margin isn't one of them. Nor is any emissions figure or safety record, even under natural and human capital.
Twenty pages later, the five-year summary is honest (pp. 62-63). Operating EBIT margin fell from 10.0% to 8.4%, and profit before tax fell from ₹19,413 crore to ₹18,863 crore. The MD&A gives the reason in one paragraph (p. 259): commodity prices, supply costs from the West Asia conflict, and a decision not to pass the full cost increases on to customers while demand recovered. Its table on page 291 shows the rest:
- Material cost rose from 73.8% to 75.9% of net sales.
- Other income fell from ₹5,065 crore to ₹4,392 crore, as treasury returns dropped.
- Deferred tax fell from ₹1,234 crore to ₹99 crore. That is why profit after tax rose even though profit before tax fell.
None of this is hidden. But a reader of the first 60 pages would come away thinking the year was better for shareholders than it was. The decision to protect volume at the cost of margin is a strategy choice, and it belongs on the highlights page with its price.
Dated targets, and two capacity numbers
The strategy story is the report's strength. The theme pages (pp. 2-3) and the Chairman's and MD's letters set out targets with dates:
- seven new SUVs in five years;
- capacity of 2.9 million units by the end of FY 2026-27, with a new 1-million-unit site at Sanand costing ₹35,000 crore;
- a 2030-31 powertrain mix of 15% battery electric, 25% strong hybrid, 35% CNG and 25% ethanol-blended petrol (p. 65);
- rail carrying 35% of vehicle dispatches by FY 2030-31, up from 26.5%;
- 11% women in the workforce by FY 2030-31, against 5.18% now (pp. 86, 123).
The Chairman's letter (pp. 44-47) is written as his AGM speech. It is unusually frank. It says the company ended March with 1.9 lakh pending bookings because it had too little capacity for the models customers wanted, after years of adjusting lines for a shrinking small-car market (p. 45). It also uses data from after the year end: first-quarter FY 2026-27 sales up 38% against 28% for the industry.
The problem is that the targets don't agree. The Chairman says installed capacity will be 3.65 million units at the end of FY 2030-31 (p. 46). The MD&A speaks of an "ambition of scaling production to 4 million units per annum by FY 2030-31" (p. 286), and the External Environment page calls 4 million the "medium-term objective" (p. 106). Capacity is the main idea of the report, and it should have one number.
The value-creation model leaves out what Suzuki is paid
- ₹5,392 crRoyalty paid
About 3.1% of net sales and 37% of profit after tax.
- ₹676 crMaruti’s own R&D spend
The royalty is approximately eight times this spend.
Source — report pp. 58–59, 398 and 416, as cited in this review. Royalty and R&D are different cost categories. Their scale is compared here to explain the review’s call for technology costs to appear in the value creation narrative.
The business model spread (pp. 58-59) is tidy. It shows inputs on the left, a seven-step growth flywheel in the middle and outputs on the right, for each capital. Some boxes carry numbers: ₹676 crore of R&D spend, 3,369 R&D engineers, 1.8 million employee suggestions saving ₹531 crore.
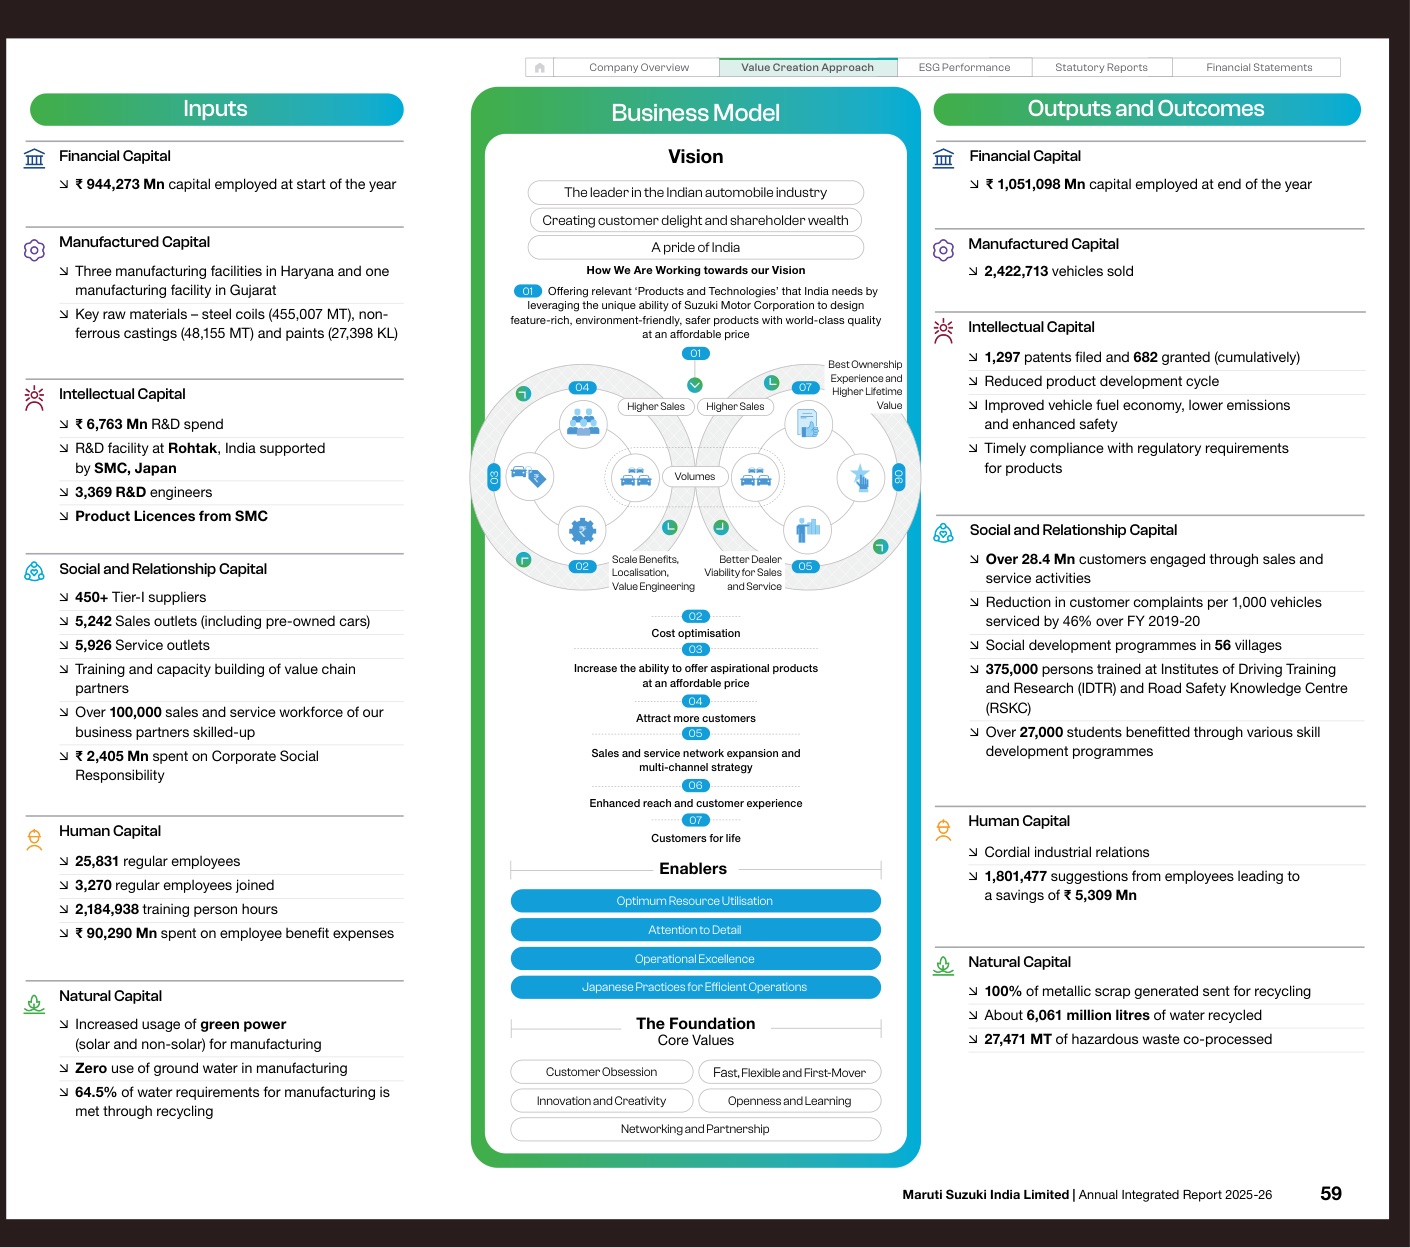
Under intellectual capital, one input is "Product Licences from SMC". Suzuki Motor Corporation owns 58.53% of Maruti (p. 15), and the report credits it throughout for products, technology and regulatory compliance. What the model doesn't show is the price. Royalty paid to Suzuki was ₹53,918 million (₹5,392 crore) in FY 2025-26, up 7% (p. 398 and the related-party note on p. 416). That is about 3.1% of net sales, 37% of profit after tax, and eight times Maruti's own R&D spend.
The figure doesn't appear in the integrated section, the MD&A or the governance pages. The Board's report sends readers to Form AOC-2 and the notes for related-party transactions. For a company whose model depends on its parent's technology, the cost of that technology is a core number. An integrated report should show it next to the R&D spend it partly replaces.
The rest of the capitals section is mostly activity. Pages 60-99 cover the supplier ecosystem, powertrains, circularity, water, safety, people and CSR, with useful data. Outcomes are rarely linked across capitals. Nowhere does the report connect the capacity plan to the emissions target.
The CAFE chart, and a 59% cut still to come
- 645,228FY 2025–26 chart figure
Own operations, as reported on p. 133.
- 266,000FY 2030–31 goal
The Chairman’s stated goal on p. 46.
- ≈59%Reduction from chart figure
Illustrative arithmetic between these two figures, while capacity is planned to expand.
The Chairman gives the current footprint as 615,000 tonnes. The report does not reconcile this with the chart’s 645,228. Its parent-set 42% target uses a separate FY 2022–23 baseline.
Source — report pp. 46, 70 and 133, as cited in this review. The 59% comparison is the review’s calculation, rather than the report’s formal baseline target.
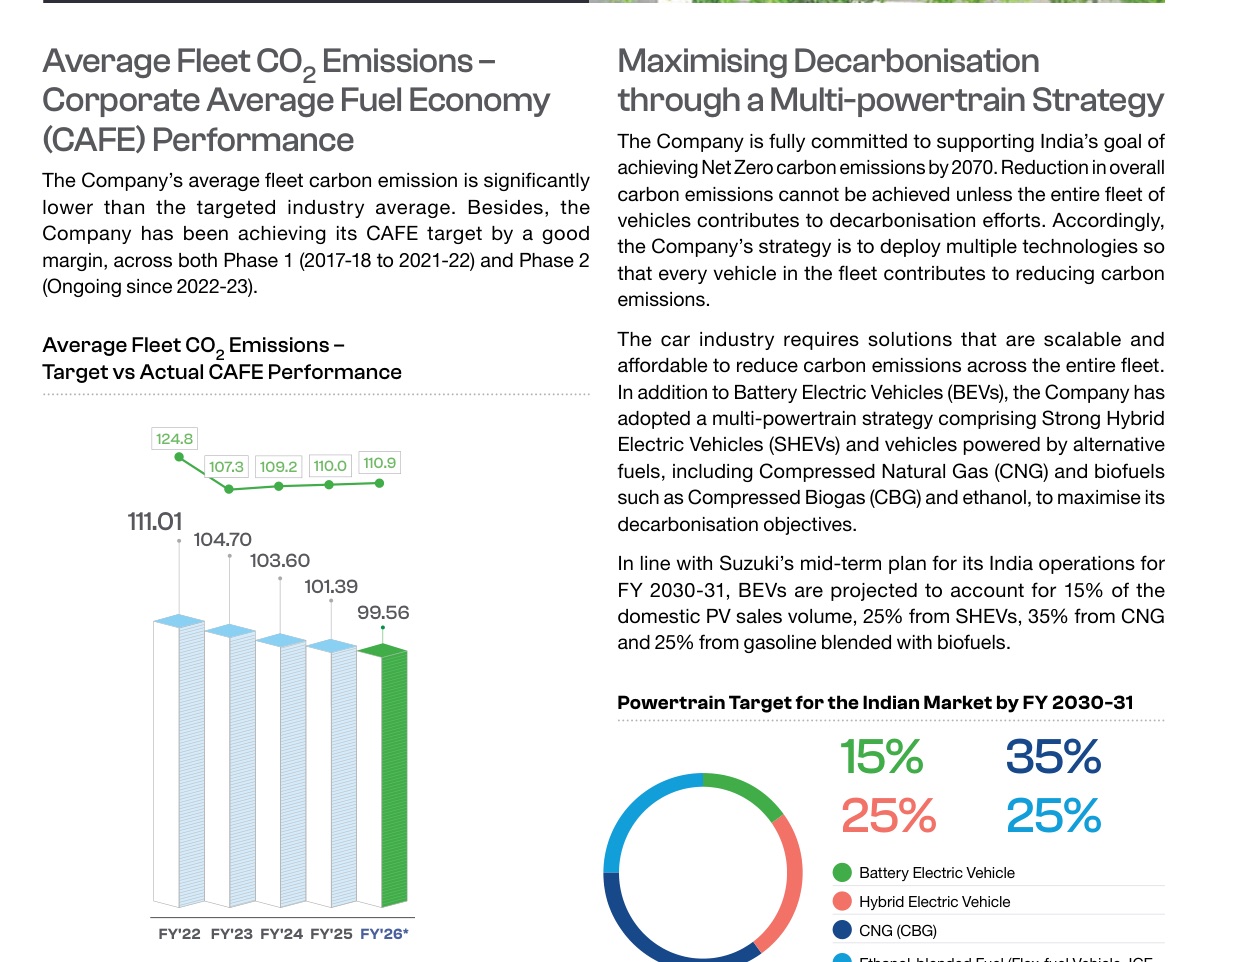
The best page in the report for anyone following car-industry emissions is page 65. It charts Maruti's average fleet CO2 against its regulatory target for five years: 111.01 g/km against 124.8 in FY 2021-22, falling to 99.56 against 110.9 in FY 2025-26 (the latest year is a provisional internal estimate). Next to it is the 2030-31 powertrain mix. That is target-against-actual reporting for the emissions that matter most. Use-phase (Scope 3 category 11) emissions are 32.1 million tonnes, about 50 times the company's own Scope 1 and 2 (p. 133).
The factory emissions story is harder to follow. Page 70 says the Scope 1 and 2 target, a 42% cut by FY 2030-31 from FY 2022-23, "has been set by our parent organisation". The baseline isn't shown on the same boundary: the chart on page 133 gives restated figures only from FY 2024-25. That chart shows Scope 1 and 2 from own operations rising from 609,361 tonnes to 645,228 tonnes this year. The Chairman puts the current footprint at 615,000 tonnes and promises 266,000 tonnes by FY 2030-31 (p. 46). The report doesn't reconcile his number with the chart.
Either way, the arithmetic is steep. From 645,228 tonnes, 266,000 is a 59% cut in five years, while installed capacity grows from about 2.4 million to 3.65 million units or more. The levers listed are renewable electricity (22.8% now, 85% planned), solar (79 MWp to 319 MWp) and biogas (0.7 tonnes a day to 10.7 by 2027). The report never adds these up to show how they get there.
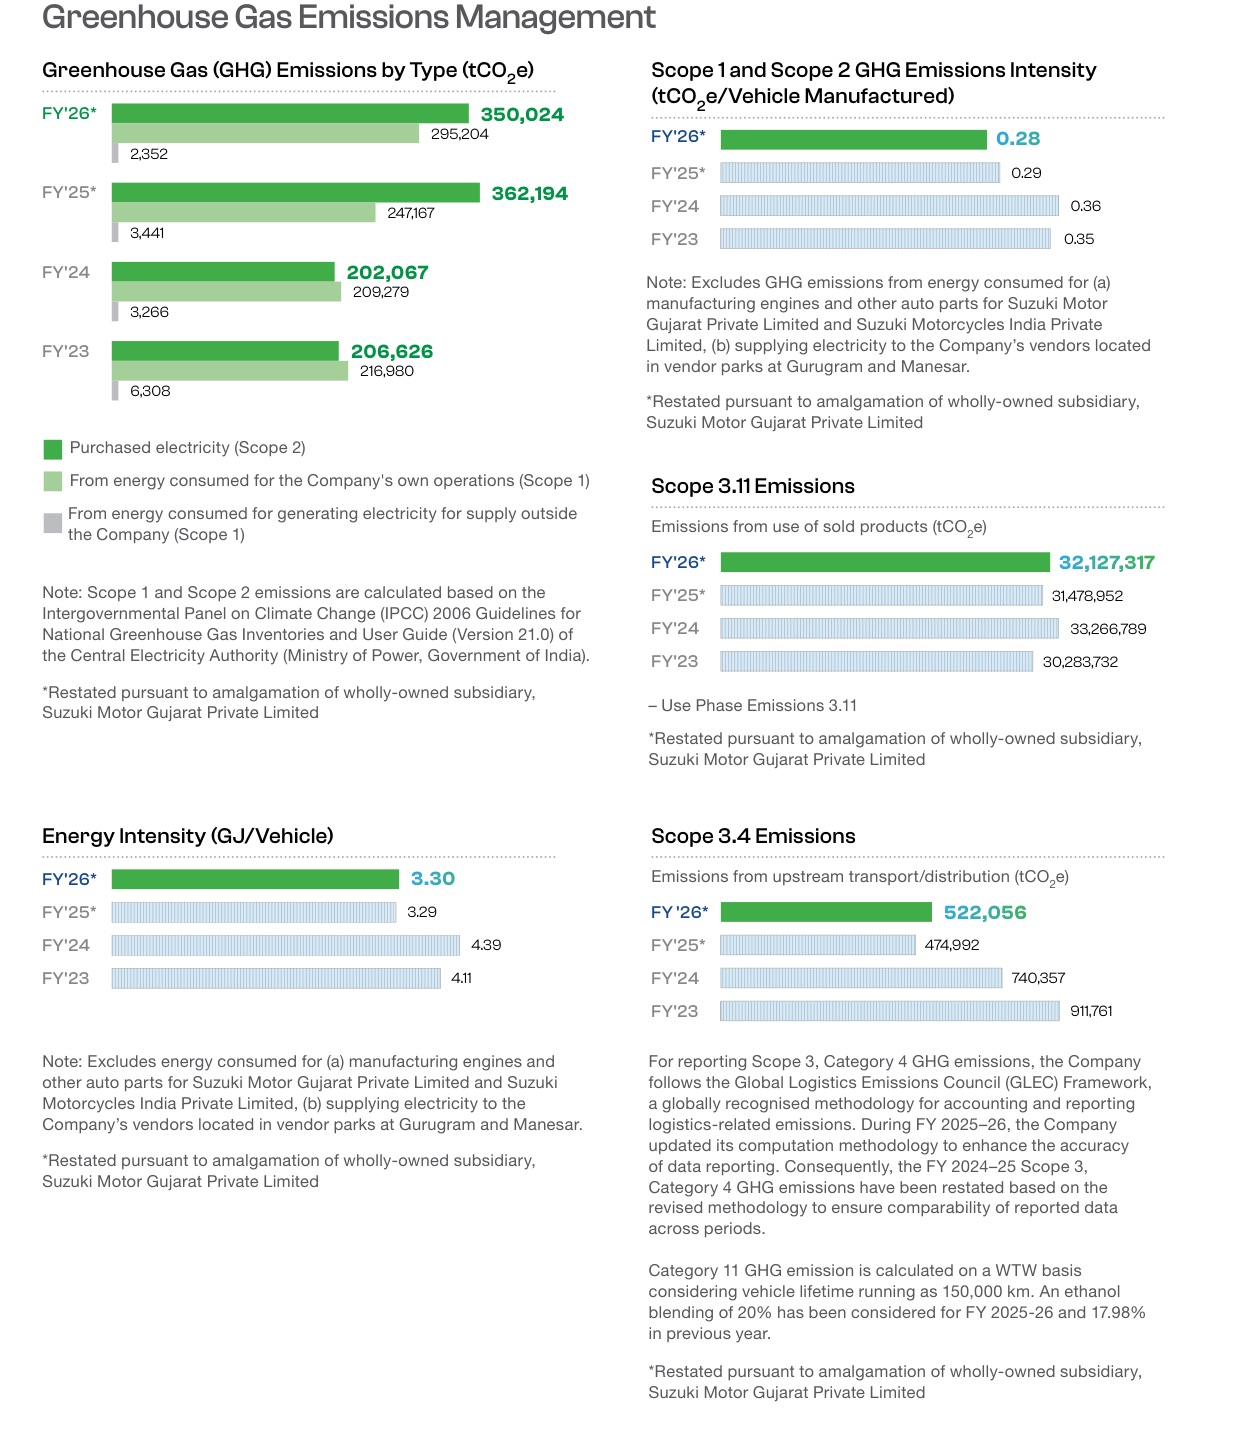
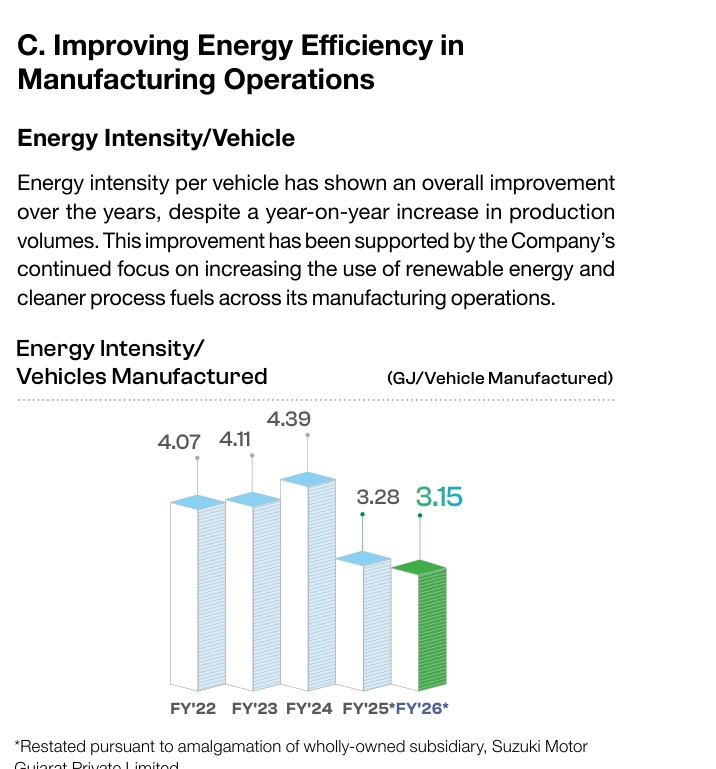
It also gives two answers for energy efficiency. The ESG section says energy intensity was 3.30 GJ per vehicle in FY 2025-26, against 3.29 the year before (p. 133). The capitals section says 3.15, against 3.28, and claims "an overall improvement" (p. 73). Both charts carry the same restatement note. One says efficiency got slightly worse, the other that it improved by 4%.
There are smaller slips of the same kind. Non-hazardous waste sent for recycling is 292,663 tonnes on page 77 and 296,663 on page 135. Employee suggestions are 1,801,567 on page 42 and 1,801,477 on page 59. The Way Forward page sets a goal that products be "85% recyclable" (p. 121), when the report says they are already above 92% (p. 76).
The water data is better: zero groundwater use for five years, 64.5% of water recycled, plant-by-plant intensity, and "water positive" indices of 1.90 at Gurugram and 1.23 at Manesar (pp. 78-79). The BRSR sits inside the report, and Bureau Veritas gives reasonable assurance on its Core indicators (p. 296). The BRSR records no fatalities among employees or workers (p. 314), and the Chairman says so too (p. 47).
Materiality is weak. The 2024-25 topic list was "revalidated through internal stakeholder consultations" (p. 112). The External Environment page (p. 106) gives climate change a short passage. Neither discusses physical climate risk or what happens if EV adoption runs ahead of the 15% plan.
Governance: a board grid, an unrated risk list
The governance pages (pp. 180-188) cover the basics clearly:
- The Board has 12 directors: four independent, four non-executive non-independent (including the Chairman), and four executive (p. 181).
- The Audit Committee is fully independent.
- The competencies are shown as a grid, director by director, in the governance report (pp. 244-245), not as prose.
- The whistleblower and POSH numbers are given: two complaints each (p. 185).
Two things are missing. The report has no statement that the Board takes responsibility for the integrated report. And the risk section (pp. 118-119) lists six risks with mitigations, but no ratings, trends, owners or numbers.
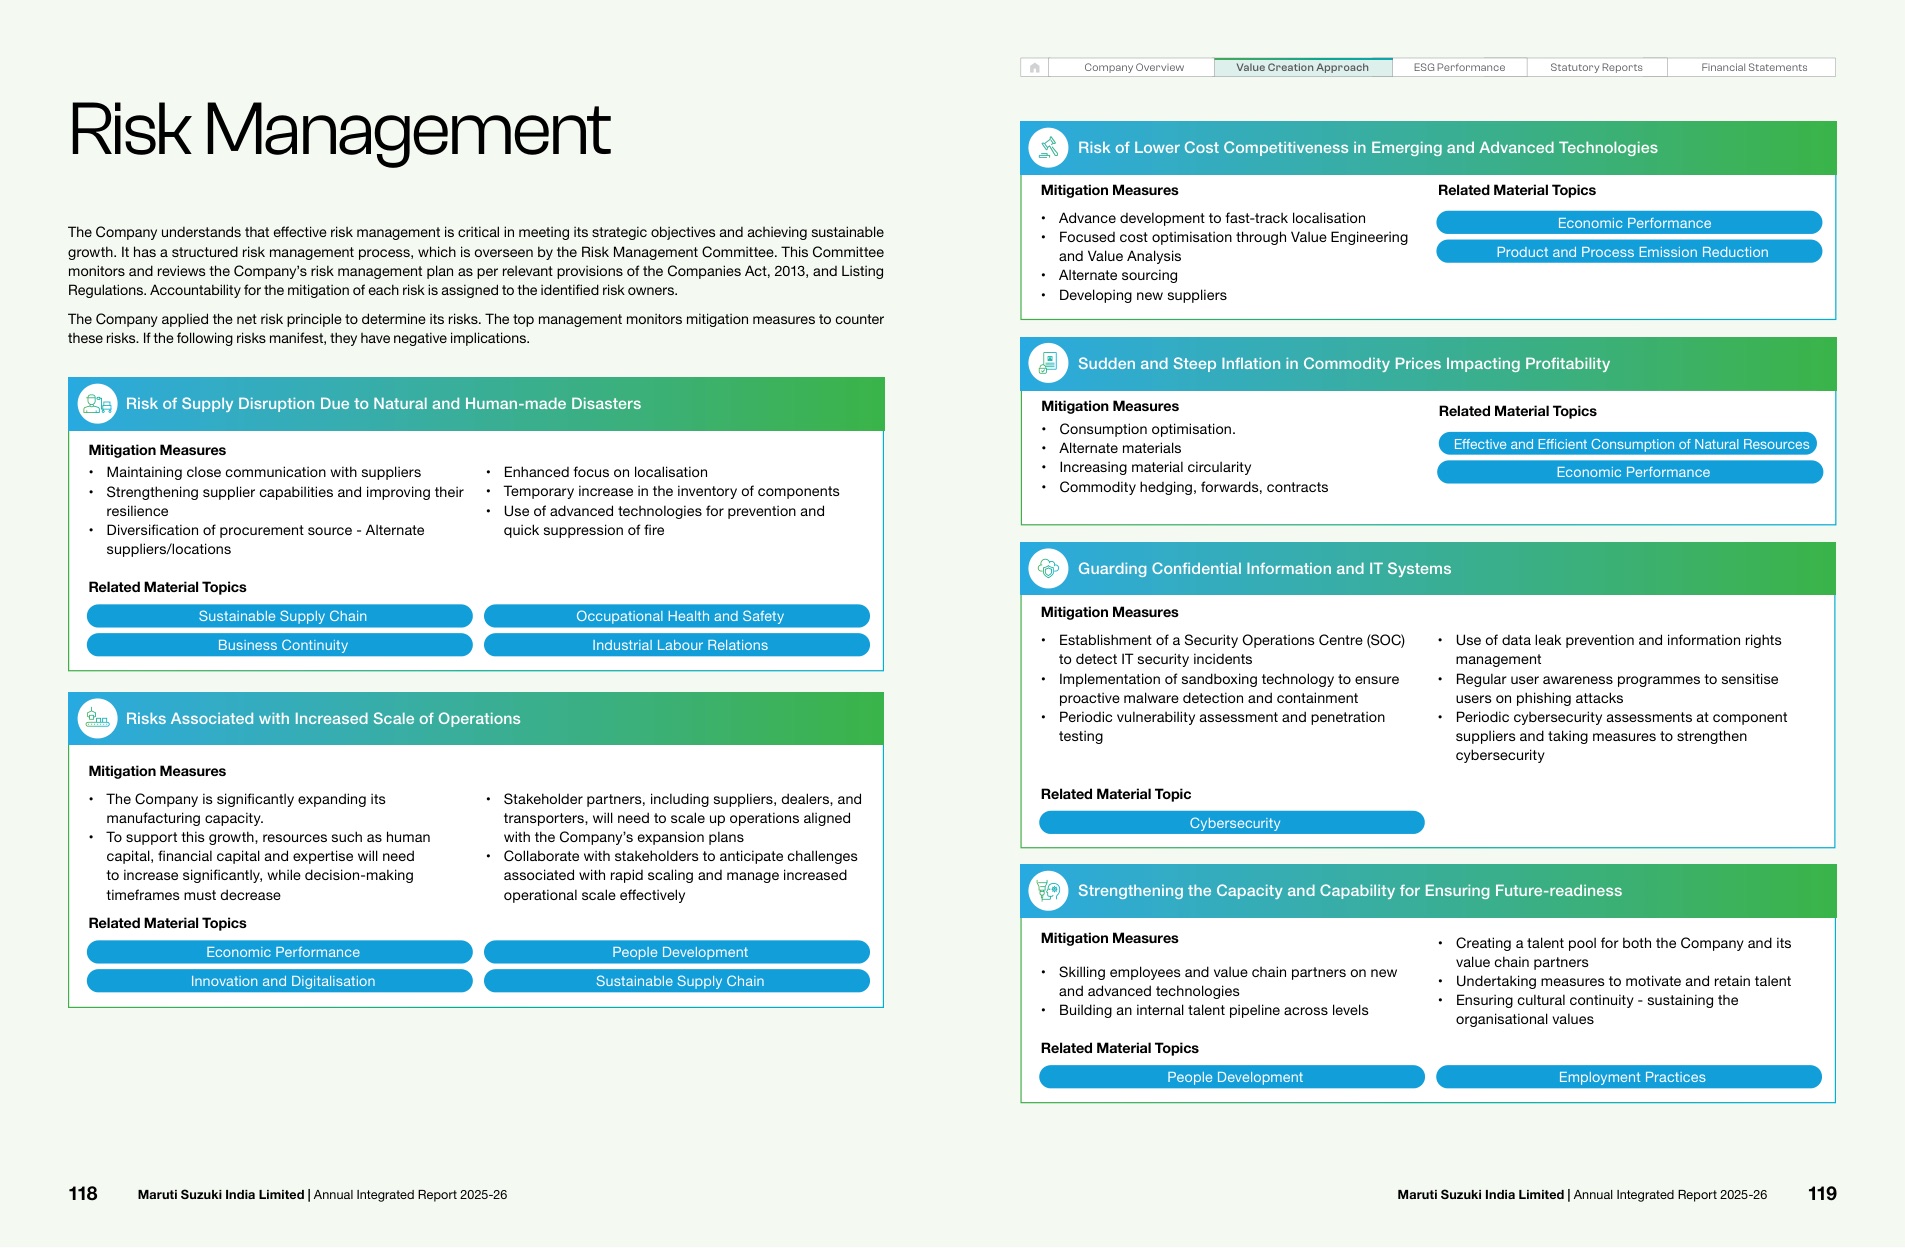
None of the six is dependence on Suzuki for technology, though the report calls Suzuki's capabilities "a critical enabler" (p. 107). None is climate or regulation. The stakeholder pages also misdirect. Shareholders' question about "the excess cash on the books" is answered at "Page 106" (p. 111), which is the External Environment page. The answer is on page 292: ₹73,234 crore in debt mutual funds and fixed deposits, earning ₹3,896 crore, down from ₹4,852 crore.
Twenty pages of cars before the numbers
The design is clean and the charts are easy to read, with the current year picked out in green. The ordering is the problem. The product portfolio and technology pages run from page 20 to page 39, and awards fill pages 40-41, so the first performance data arrives on page 42. CSR projects take another twelve pages (pp. 88-99) before the ESG section covers much of the same ground again. A few lines escaped proofreading: "one of the biggest the biggest employment generators" (p. 60), "expanded its multi-powertrain creating, fresh momentum" (p. 2), "Facitlities" (p. 77).
The PDF is a single 24.8 MB file of 257 two-page spreads. The contents page and section tabs are clickable, which helps. But there are no usable bookmarks: the only four are leftover internal labels starting "_Hlk". The report doesn't mention an online edition. In the consolidated accounts (p. 439), the registration number of an associate, Krishna Maruti Limited, is linked to a Google search results page. It looks like a search pasted into a draft and never removed.
What other companies can copy
- Fleet emissions against the regulatory target, for five years (p. 65). Any carmaker can do this. Few Indian reports show the target line.
- A dated powertrain mix (p. 65). 15/25/35/25 by FY 2030-31 is a forecast that can be checked.
- A Chairman who admits a misjudgement (p. 45). The 1.9 lakh pending bookings and why they happened.
- Plant-by-plant water data with water-stress flags and recycling shares (pp. 78-79).
- A five-year summary that shows the margin falling (pp. 62-63). The only fault is that the front pages don't.
What not to copy: a highlights page with only up arrows in a year of falling margin, a parent-company royalty left to the notes, two capacity targets for the same year, and two energy-intensity figures for the same metric.
The score
- Strategy and narrative4 / 5
- Integrated thinking and capitals3 / 5
- BRSR and ESG integration3 / 5
- Governance disclosure3 / 5
- Financial storytelling3 / 5
- Design and readability3 / 5
- Digital version3 / 5
Seven criteria, each out of five. Scores assess reporting quality. The review’s reasons appear in the table below.
| Criterion | Score (of 5) | Why |
|---|---|---|
| Strategy and narrative | 4 | Dated, numbered targets and a frank Chairman's letter; two different 2030-31 capacity figures |
| Integrated thinking and the capitals | 3 | A neat value-creation model, but Suzuki's licences carry no number and capitals rarely connect |
| BRSR and ESG integration | 3 | CAFE target-vs-actual, BRSR inside with reasonable assurance; parent-set target, unclear baseline, conflicting intensity and internal-only materiality |
| Governance disclosure | 3 | Board grid and committee detail; unrated risks, no Board responsibility statement, royalty not discussed |
| Financial storytelling | 3 | Five-year table and MD&A explain the margin fall; the highlights and letters don't, and PAT growth rests on lower deferred tax |
| Design and readability | 3 | Clean charts, but 20 product pages before the numbers, repeated CSR and copy errors |
| Digital version | 3 | Clickable contents and tabs; no bookmarks in 510 pages, no web edition, a stray Google link |
| Total | 22 / 35 |
How it compares
Every review on The Footnotes uses the same seven-point card, so scores can be compared. Scores are editorial opinion of the published document.
| Company | Score (of 35) |
|---|---|
| Hindustan Zinc | 30 |
| HUL | 28 |
| TCS | 28 |
| Bharti Airtel | 27 |
| L&T | 27 |
| Reliance | 27 |
| HDFC Bank | 26 |
| Asian Paints | 25 |
| ICICI Bank | 25 |
| Infosys | 25 |
| LTM | 25 |
| Tata Steel | 25 |
| Mahindra & Mahindra | 24 |
| Titan | 23 |
| Adani Ports | 22 |
| Maruti Suzuki (this review) | 22 |
| ITC | 21 |
| SBI | 21 |
| Sun Pharma | 21 |
| Bajaj Finance | 20 |
| NTPC | 20 |
Frequently asked questions
What were Maruti Suzuki's FY 2025-26 results?
Net sales were ₹1,74,370 crore, up 20.2%, on record volumes of 2,422,713 vehicles, including 447,774 exports. Profit after tax was ₹14,445 crore, up 1.0%. Profit before tax fell 2.8% to ₹18,863 crore. Operating EBIT margin fell from 10.0% to 8.4%. The Board recommended a ₹140 dividend per share. Figures are standalone and restated for the merger of Suzuki Motor Gujarat.
Why did Maruti Suzuki's profit barely grow when sales rose 20%?
The MD&A (p. 259) puts it down to higher commodity prices, supply-side pressure from the West Asia conflict, and the company's choice not to pass on the full cost increases to customers. Material cost rose from 73.8% to 75.9% of net sales (p. 291). Profit after tax still rose slightly because deferred tax fell from ₹1,234 crore to ₹99 crore.
How much royalty does Maruti Suzuki pay Suzuki Motor Corporation?
₹53,918 million (₹5,392 crore) in FY 2025-26, up from ₹50,380 million, paid to Suzuki Motor Corporation, which owns 58.53% of Maruti. The figure is in the other-expenses note (p. 398) and the related-party note (p. 416). It is about 3.1% of net sales and 37% of profit after tax. The integrated sections of the report don't state it.
What are Maruti Suzuki's climate targets?
Suzuki Motor Corporation has set a target to cut Maruti's Scope 1 and 2 emissions 42% by FY 2030-31 from FY 2022-23 (p. 70). The Chairman says production emissions will fall to 266,000 tonnes by FY 2030-31 (p. 46). Other targets: renewable electricity from 22.8% to 85%, solar capacity from 79 MWp to 319 MWp, and rail's share of vehicle dispatches from 26.5% to 35%. For products, Suzuki's plan for 2030-31 is 15% battery electric, 25% strong hybrid, 35% CNG and 25% ethanol-blended petrol.
Does Maruti Suzuki's annual report include the BRSR, and who assures it?
Yes. The BRSR is at pages 296 to 343. Bureau Veritas India provides reasonable assurance on the BRSR Core indicators and limited assurance on other BRSR indicators. Price Waterhouse Chartered Accountants LLP audits the financial statements. The report covers standalone operations only; joint ventures and subsidiaries are excluded (p. 5).
How does The Footnotes score annual reports?
Seven criteria, each scored 1 to 5 with a one-line reason: strategy and narrative; integrated thinking and capitals; BRSR and ESG integration; governance disclosure; financial storytelling; design and readability; and the digital version. Scores are editorial opinion based on the published document, and the same card is used for every company so results can be compared.
Sources
- Maruti Suzuki India Limited — Annual Integrated Report 2025-26 (PDF) — Maruti Suzuki India Limited
- Maruti Suzuki investors: company updates and annual integrated reports — Maruti Suzuki India Limited
- Press release: Maruti Suzuki Annual Integrated Report 2025-26 — Maruti Suzuki India Limited
- SEBI circular on BRSR Core: framework for assurance and ESG disclosures for value chain (12 July 2023) — SEBI