


Seven FY2025-26 reports credited to Stirrup, from Grasim to Bajaj Finserv, averaged 23.7 out of 35 on our card. Here's where the work is strongest: strategy you can track, capitals with real numbers, ESG targets against progress, and the most online editions in our sample. Plus where it slips.
In this article
 In short
Key takeaways
- We scored seven FY2025-26 reports credited to Stirrup: Grasim 27, Tata Power 25, UltraTech 25, Wipro 25, Ambuja Cements 24, Torrent Pharmaceuticals 21 and Bajaj Finserv 19, an average of 23.7 out of 35.
- Six of the seven are integrated reports, averaging 24.5. The one conventional annual report, Bajaj Finserv's, scored 19.
- Stirrup's reports have the highest strategy and narrative average in our five-agency sample (3.6 out of 5): strategic priorities come with a year's progress, and Tata Power links each objective to capitals, material topics and risks.
- Value creation models carry real numbers for every capital, as at Grasim, UltraTech and Tata Power, and Tata Power's ESG table shows baseline, progress and target for each commitment.
- Five of the seven companies publish an online edition, more than for any other agency. But none of the seven PDFs has a usable set of bookmarks.
When we compared five annual report agencies on 35 FY2025-26 reports, Stirrup came second overall and led, or shared the lead, on three of the seven criteria. This piece goes back to the seven Stirrup-credited reports in that sample and shows, page by page, what they do well.
The seven are Grasim, Tata Power, UltraTech Cement, Wipro, Ambuja Cements, Torrent Pharmaceuticals and Bajaj Finserv. Five credit Stirrup with "concept, content and design", Grasim's says "concept and design", and Bajaj Finserv's says "designed and produced". Together they averaged 23.7 out of 35, with a median of 25. Six are integrated reports, averaging 24.5; Bajaj Finserv's conventional annual report scored 19.
One caveat before the pages. A credit tells you who the company chose to name, not what that agency was hired to do. Finance teams, company secretaries and auditors write and sign off much of any annual report, so we're judging the published report, not Stirrup's process. Stirrup describes itself as a strategic communications consultancy and corporate design studio, and lists annual and integrated reports and sustainability and ESG reports among its services.
Strategy you can actually track
Stirrup's reports have the highest strategy and narrative average in our sample, 3.6 out of 5, and four of the seven score 4: Grasim, UltraTech, Tata Power and Wipro. What they share is a strategy page that does more than list ambitions.
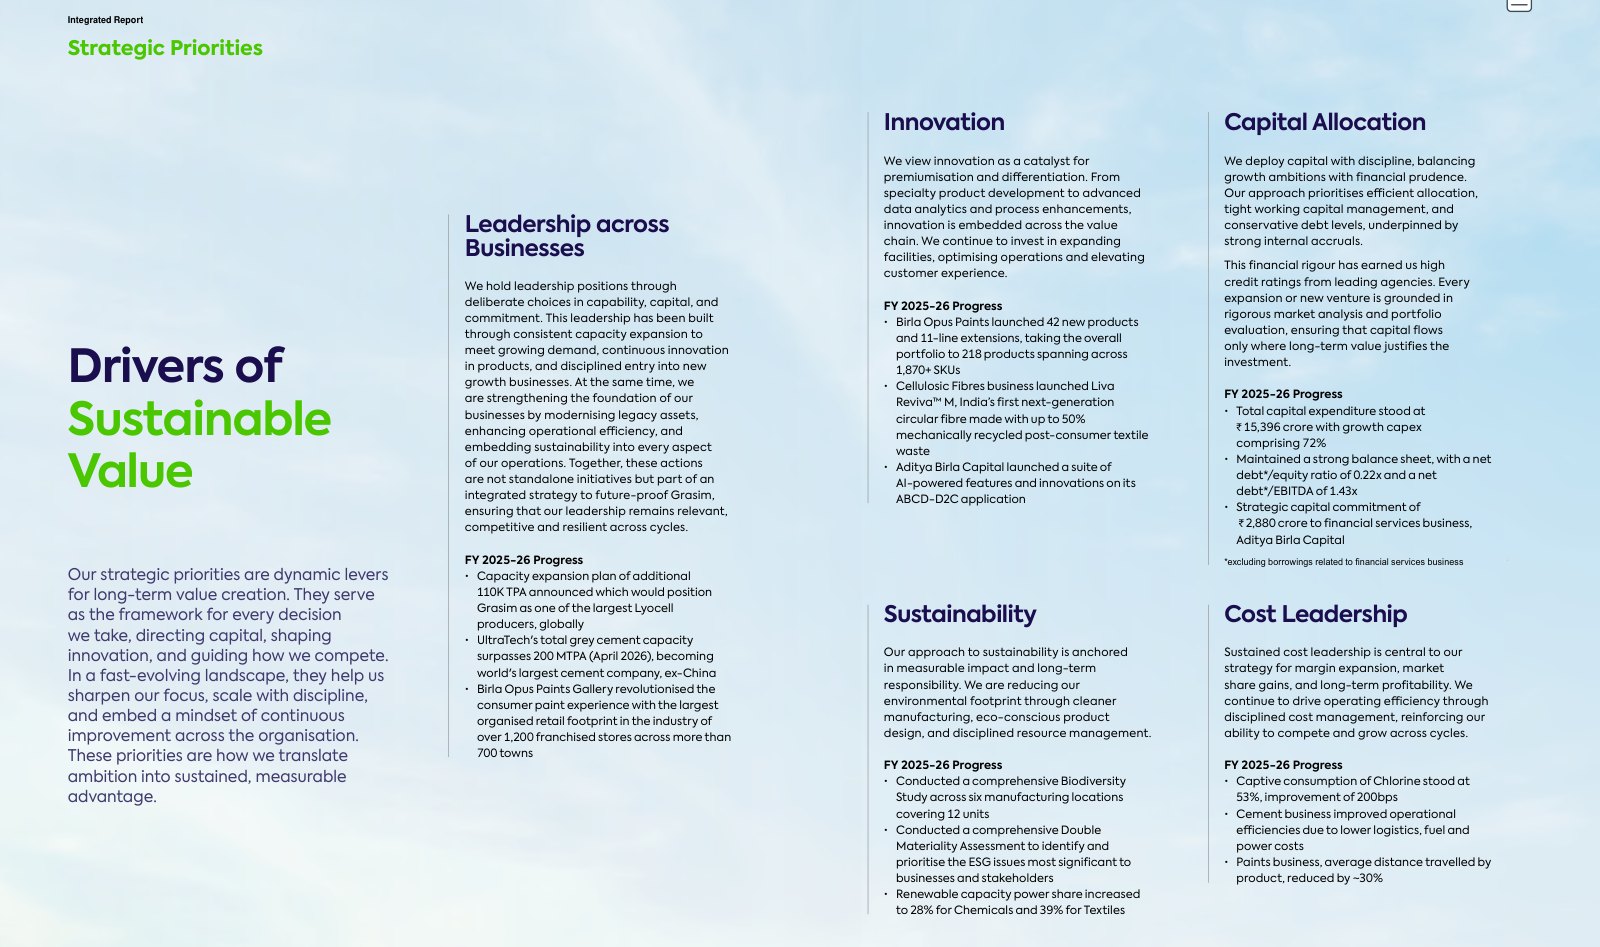
Grasim's "Drivers of Sustainable Value" spread sets out five priorities and puts a short "FY 2025-26 Progress" list under each one. It's a simple device, and it changes how the rest of the report reads, because the reader now has something to check the businesses against.
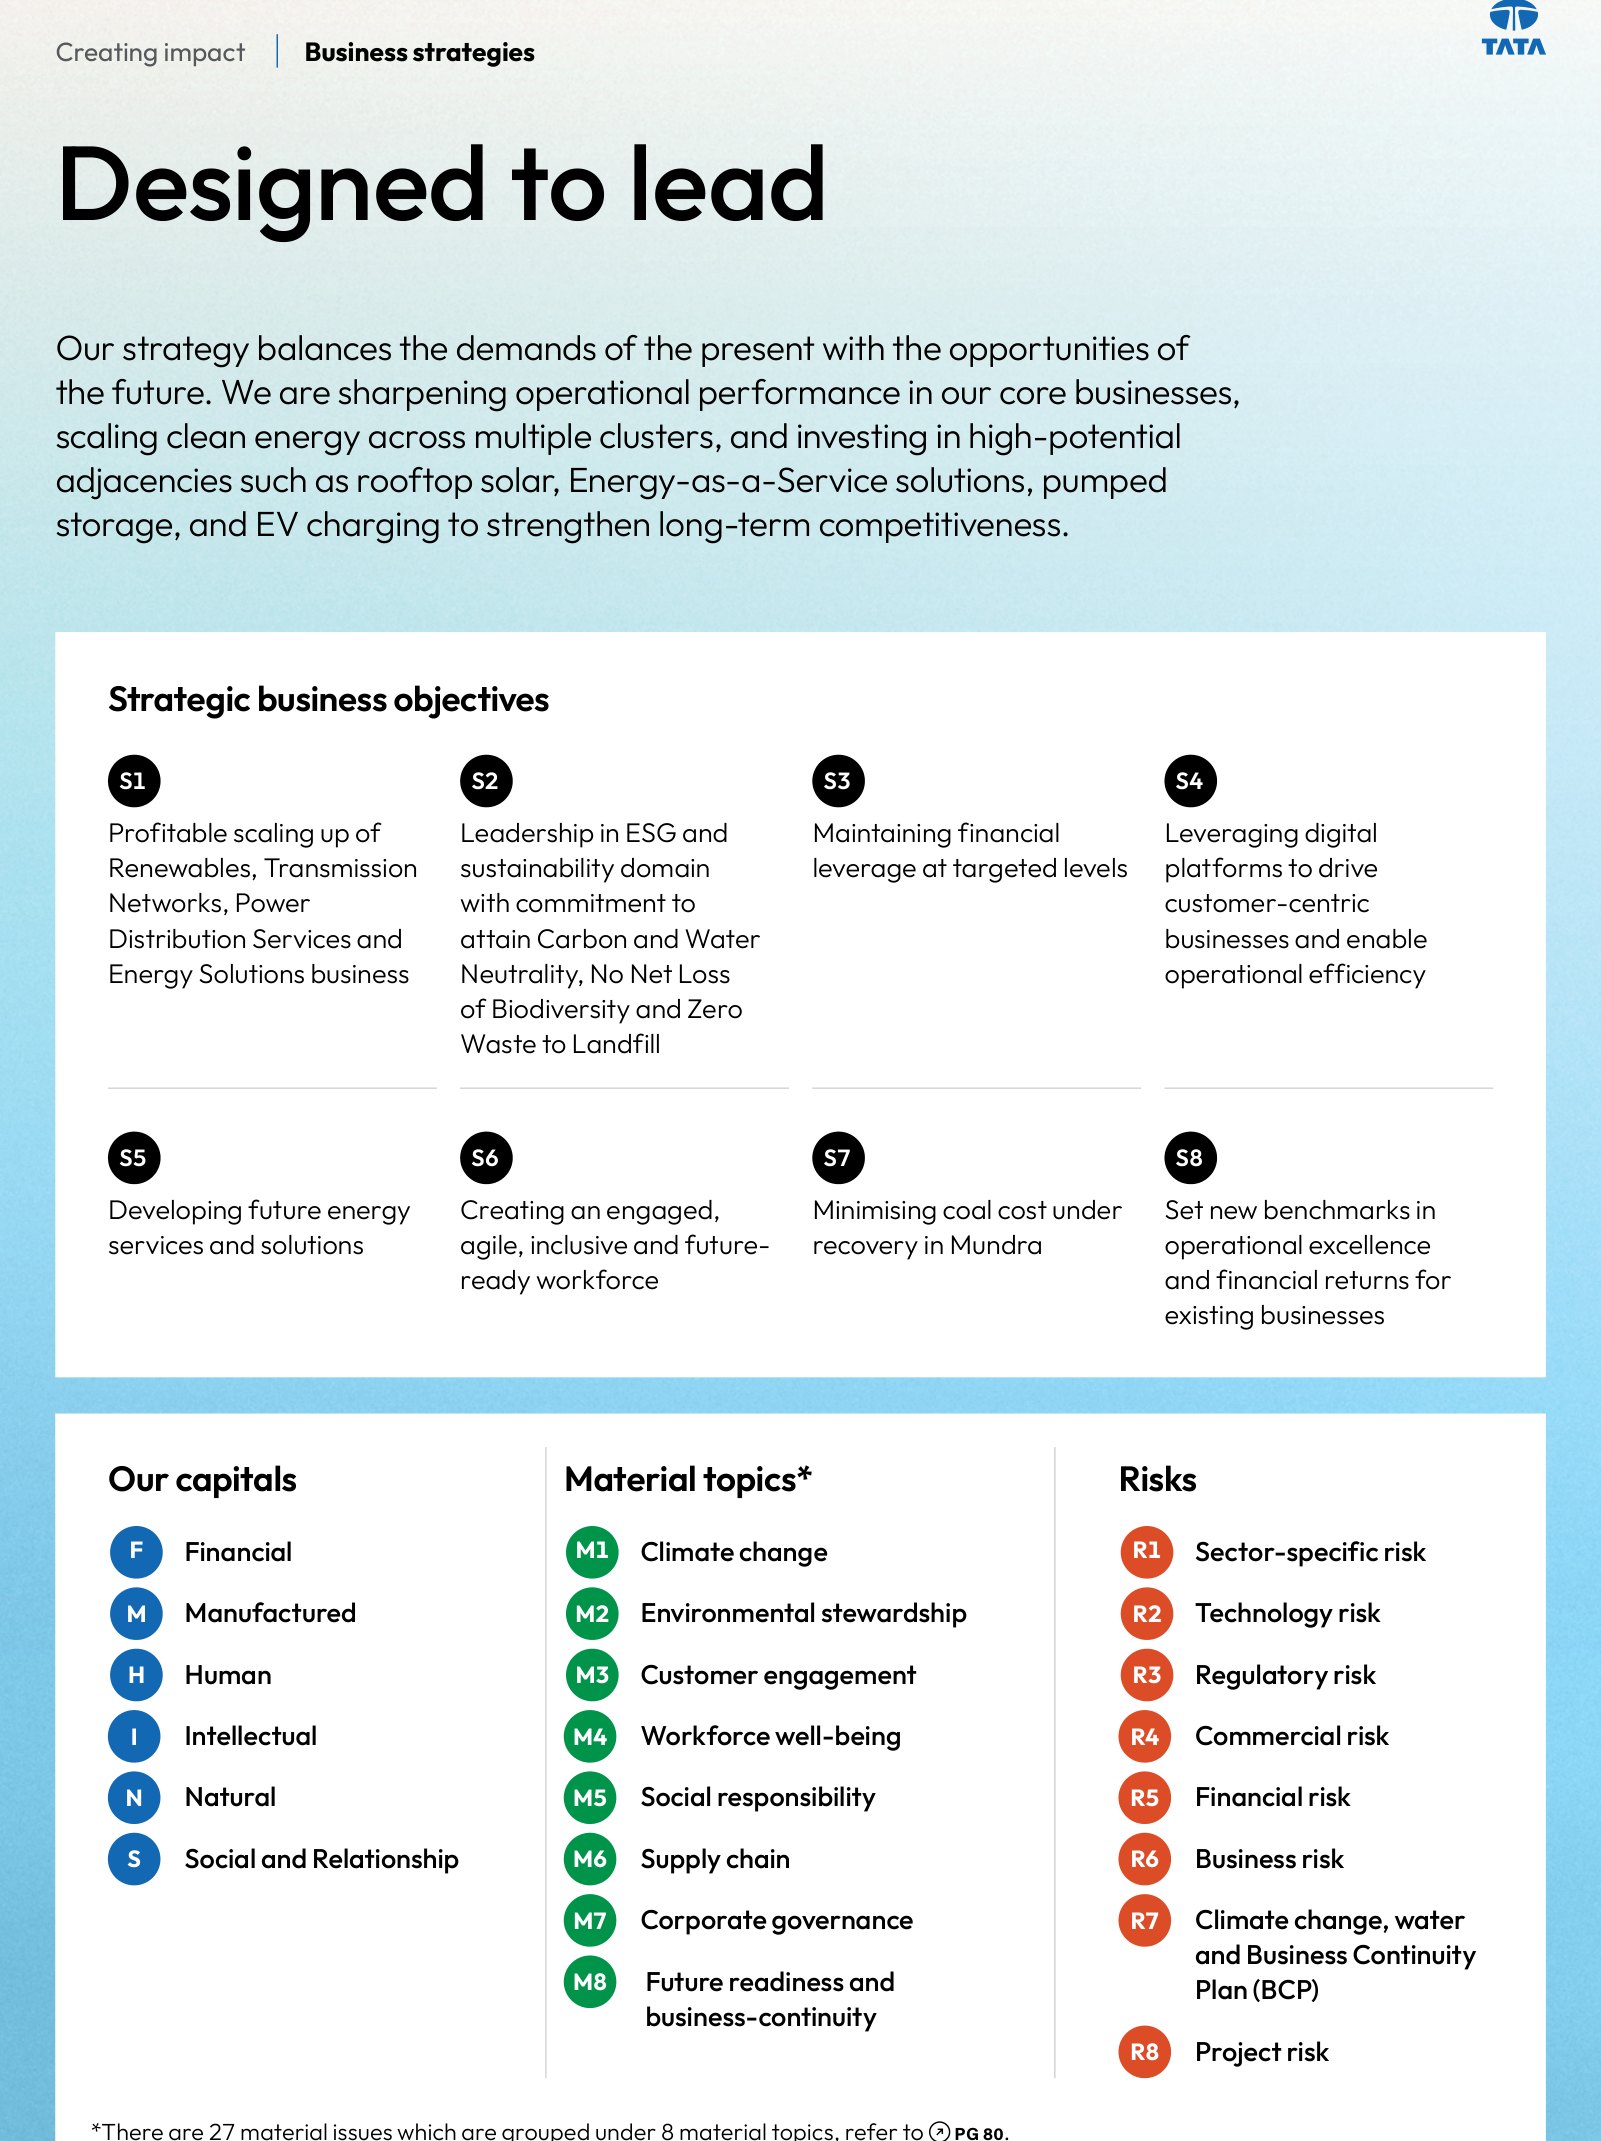
Tata Power goes a step further. Its eight strategic objectives are coded S1 to S8, and the same page sets out the capitals (F, M, H, I, N, S), eight material topics (M1 to M8) and eight risks (R1 to R8). Those codes then turn up on the business pages that follow, so a reader can see which objective, topic and risk each section is talking to.
Capitals with real numbers in them
A value creation model is easy to draw and hard to fill. Many reports in our wider sample show the six capitals as icons with a sentence each. Stirrup's integrated reports put a number against nearly every input and output, which is why they average 3.4 on integrated thinking, second only to WyattPrism.
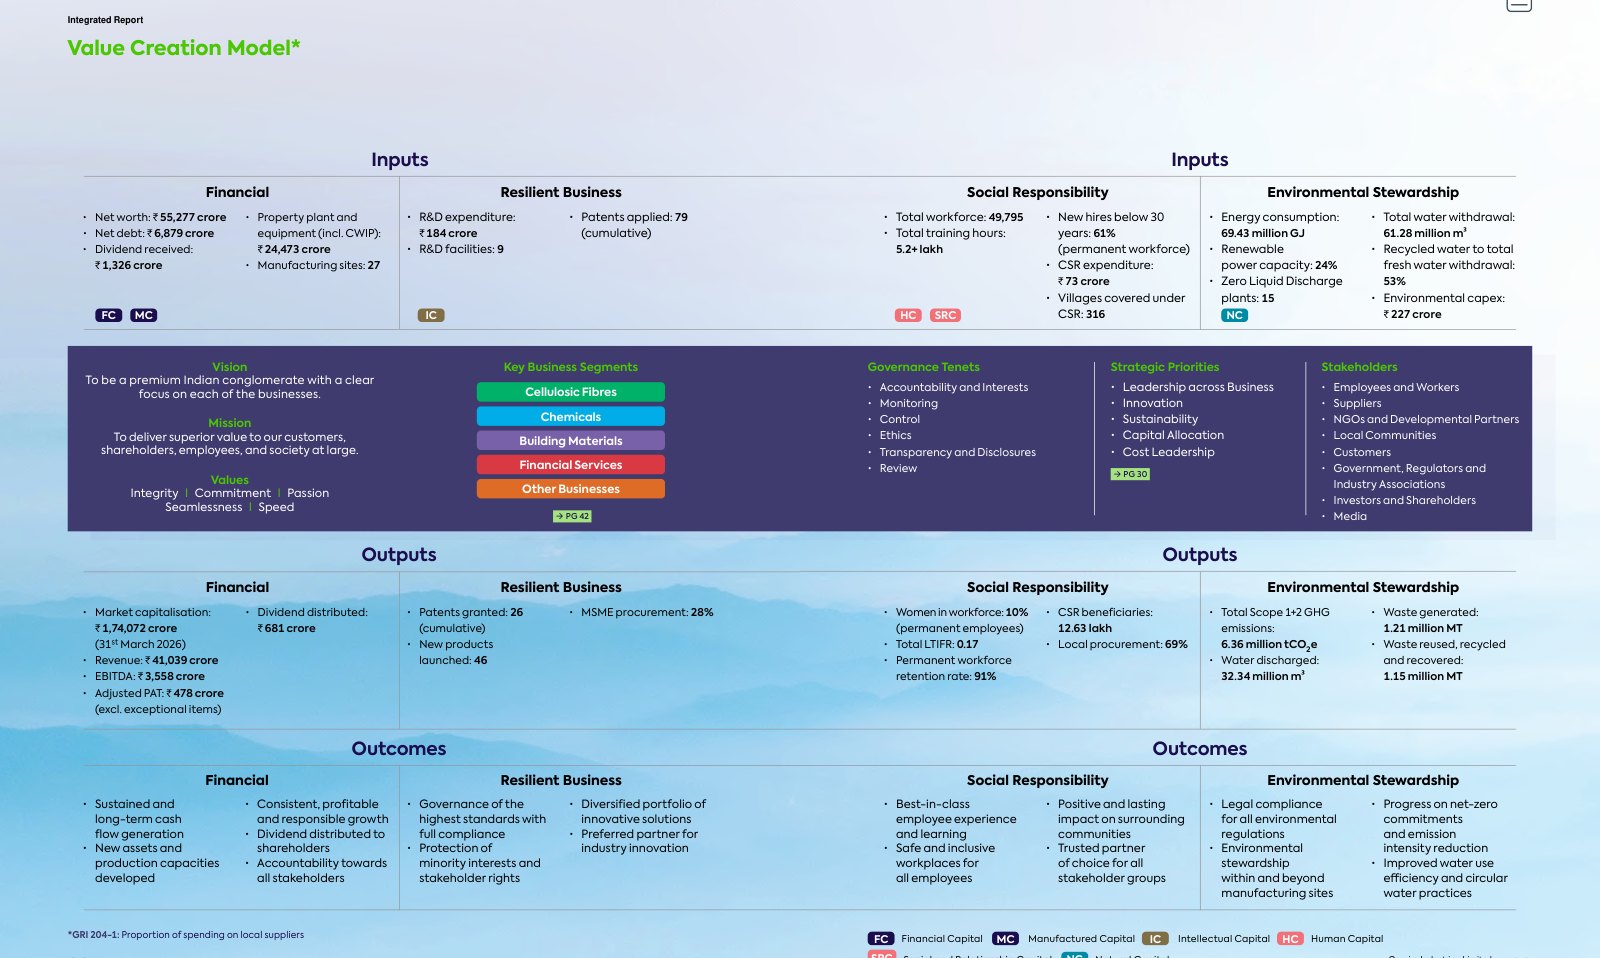
Grasim's model runs inputs, business model, outputs and outcomes across one spread, with net debt, R&D spend, workforce, energy use and water withdrawal on the input side and market capitalisation, patents, LTIFR and Scope 1+2 emissions on the output side. Each block is tagged with the capitals it draws on.
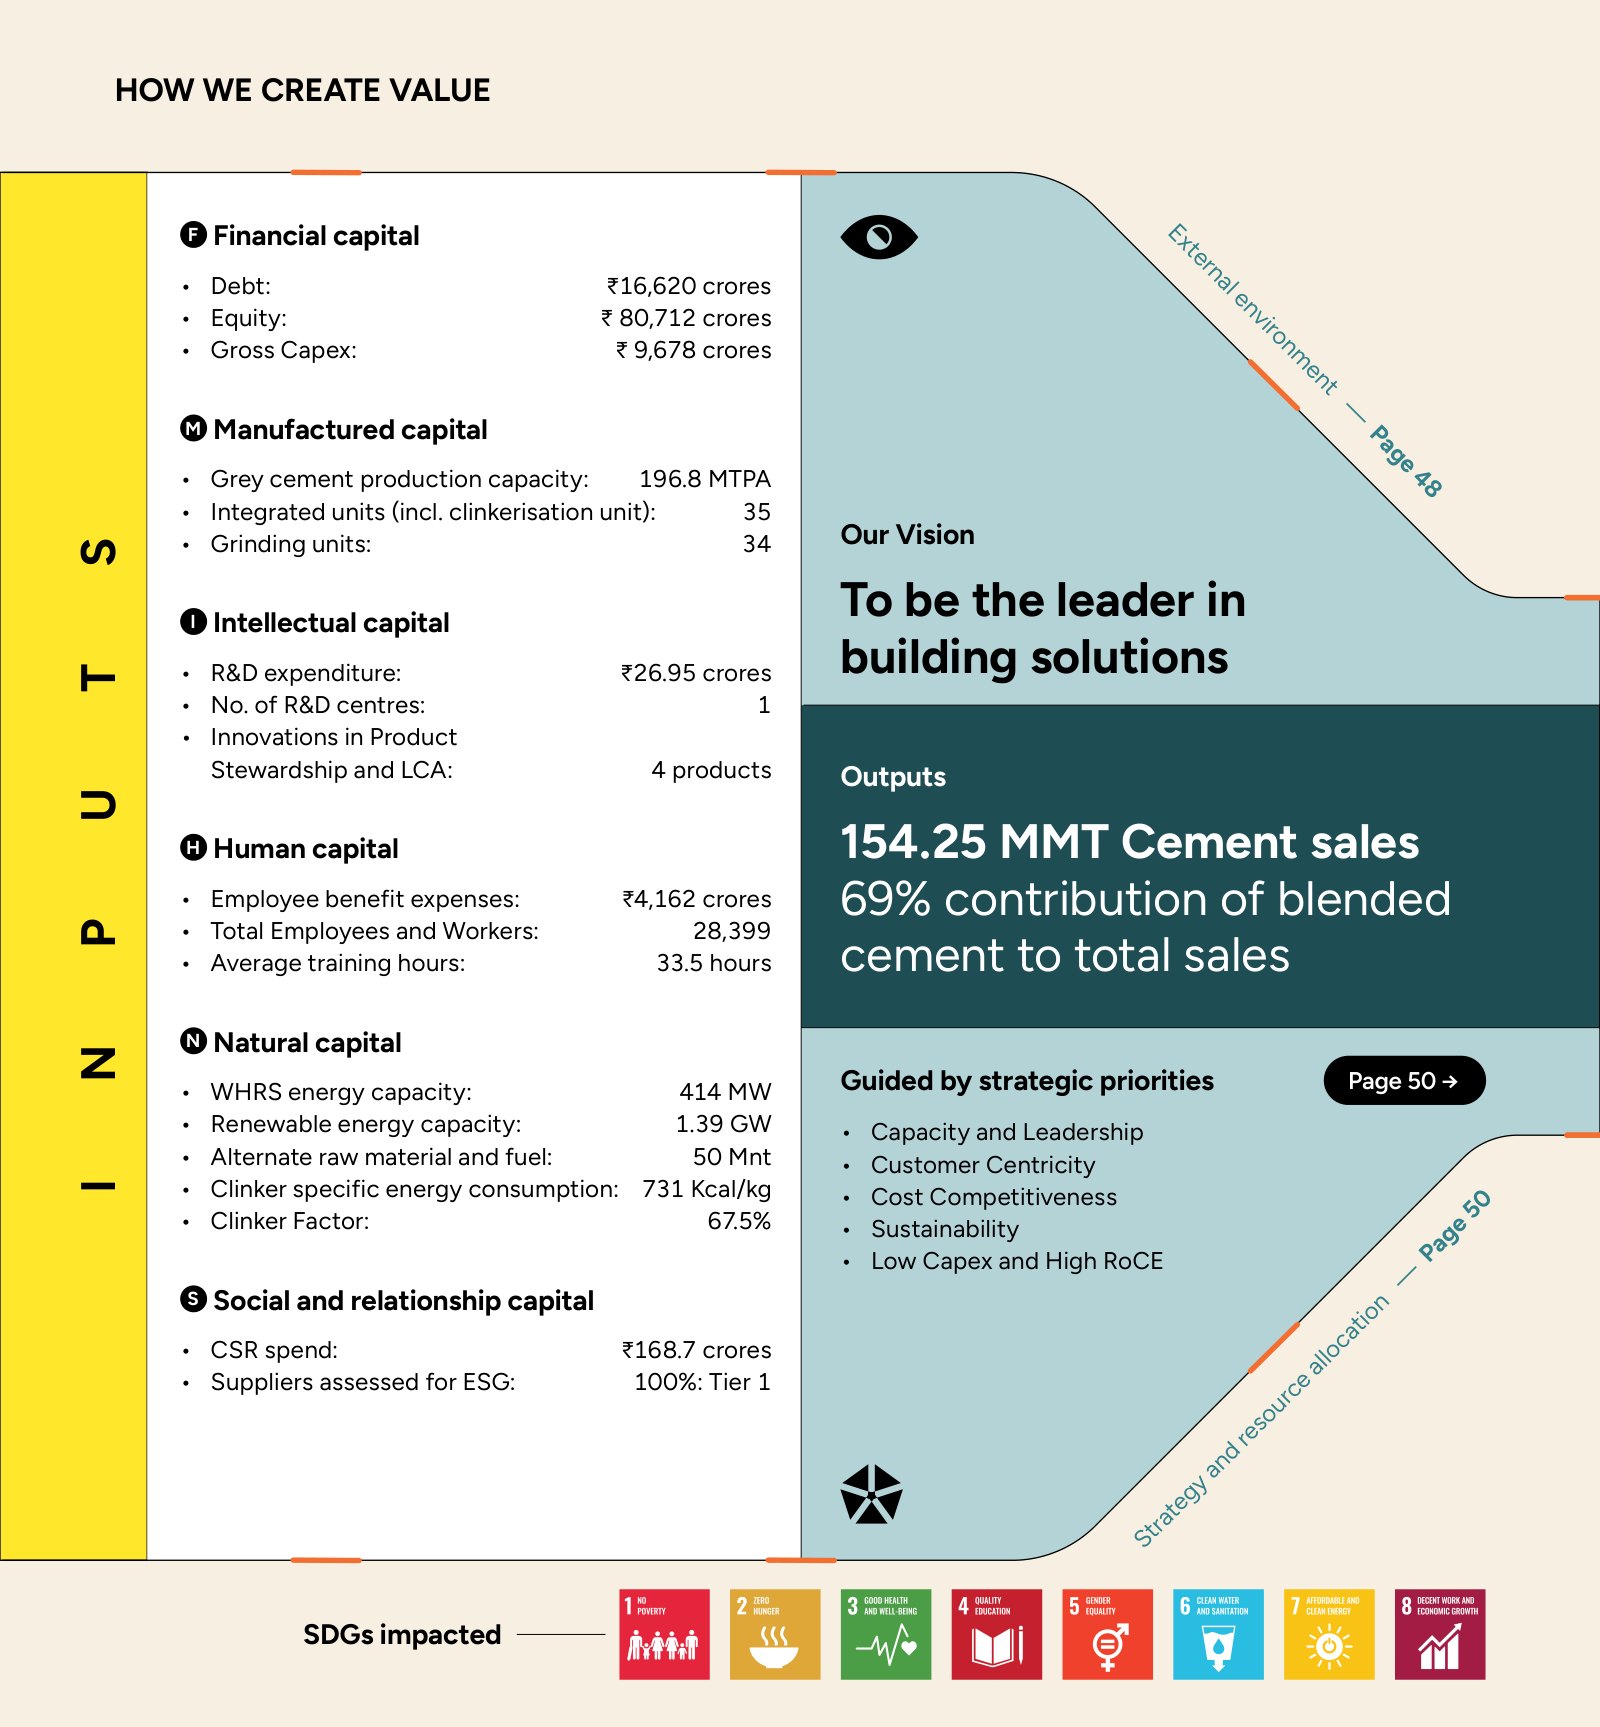
UltraTech's version opens with the inputs for each capital (debt, cement capacity, R&D spend, employees, waste heat recovery capacity, CSR spend) and runs into a single headline output: 154.25 million tonnes of cement sold. Tata Power's model (PDF p. 12) does the same job across a spread, ending in value created for each stakeholder group with page links to the detail.
ESG targets with the progress next to them
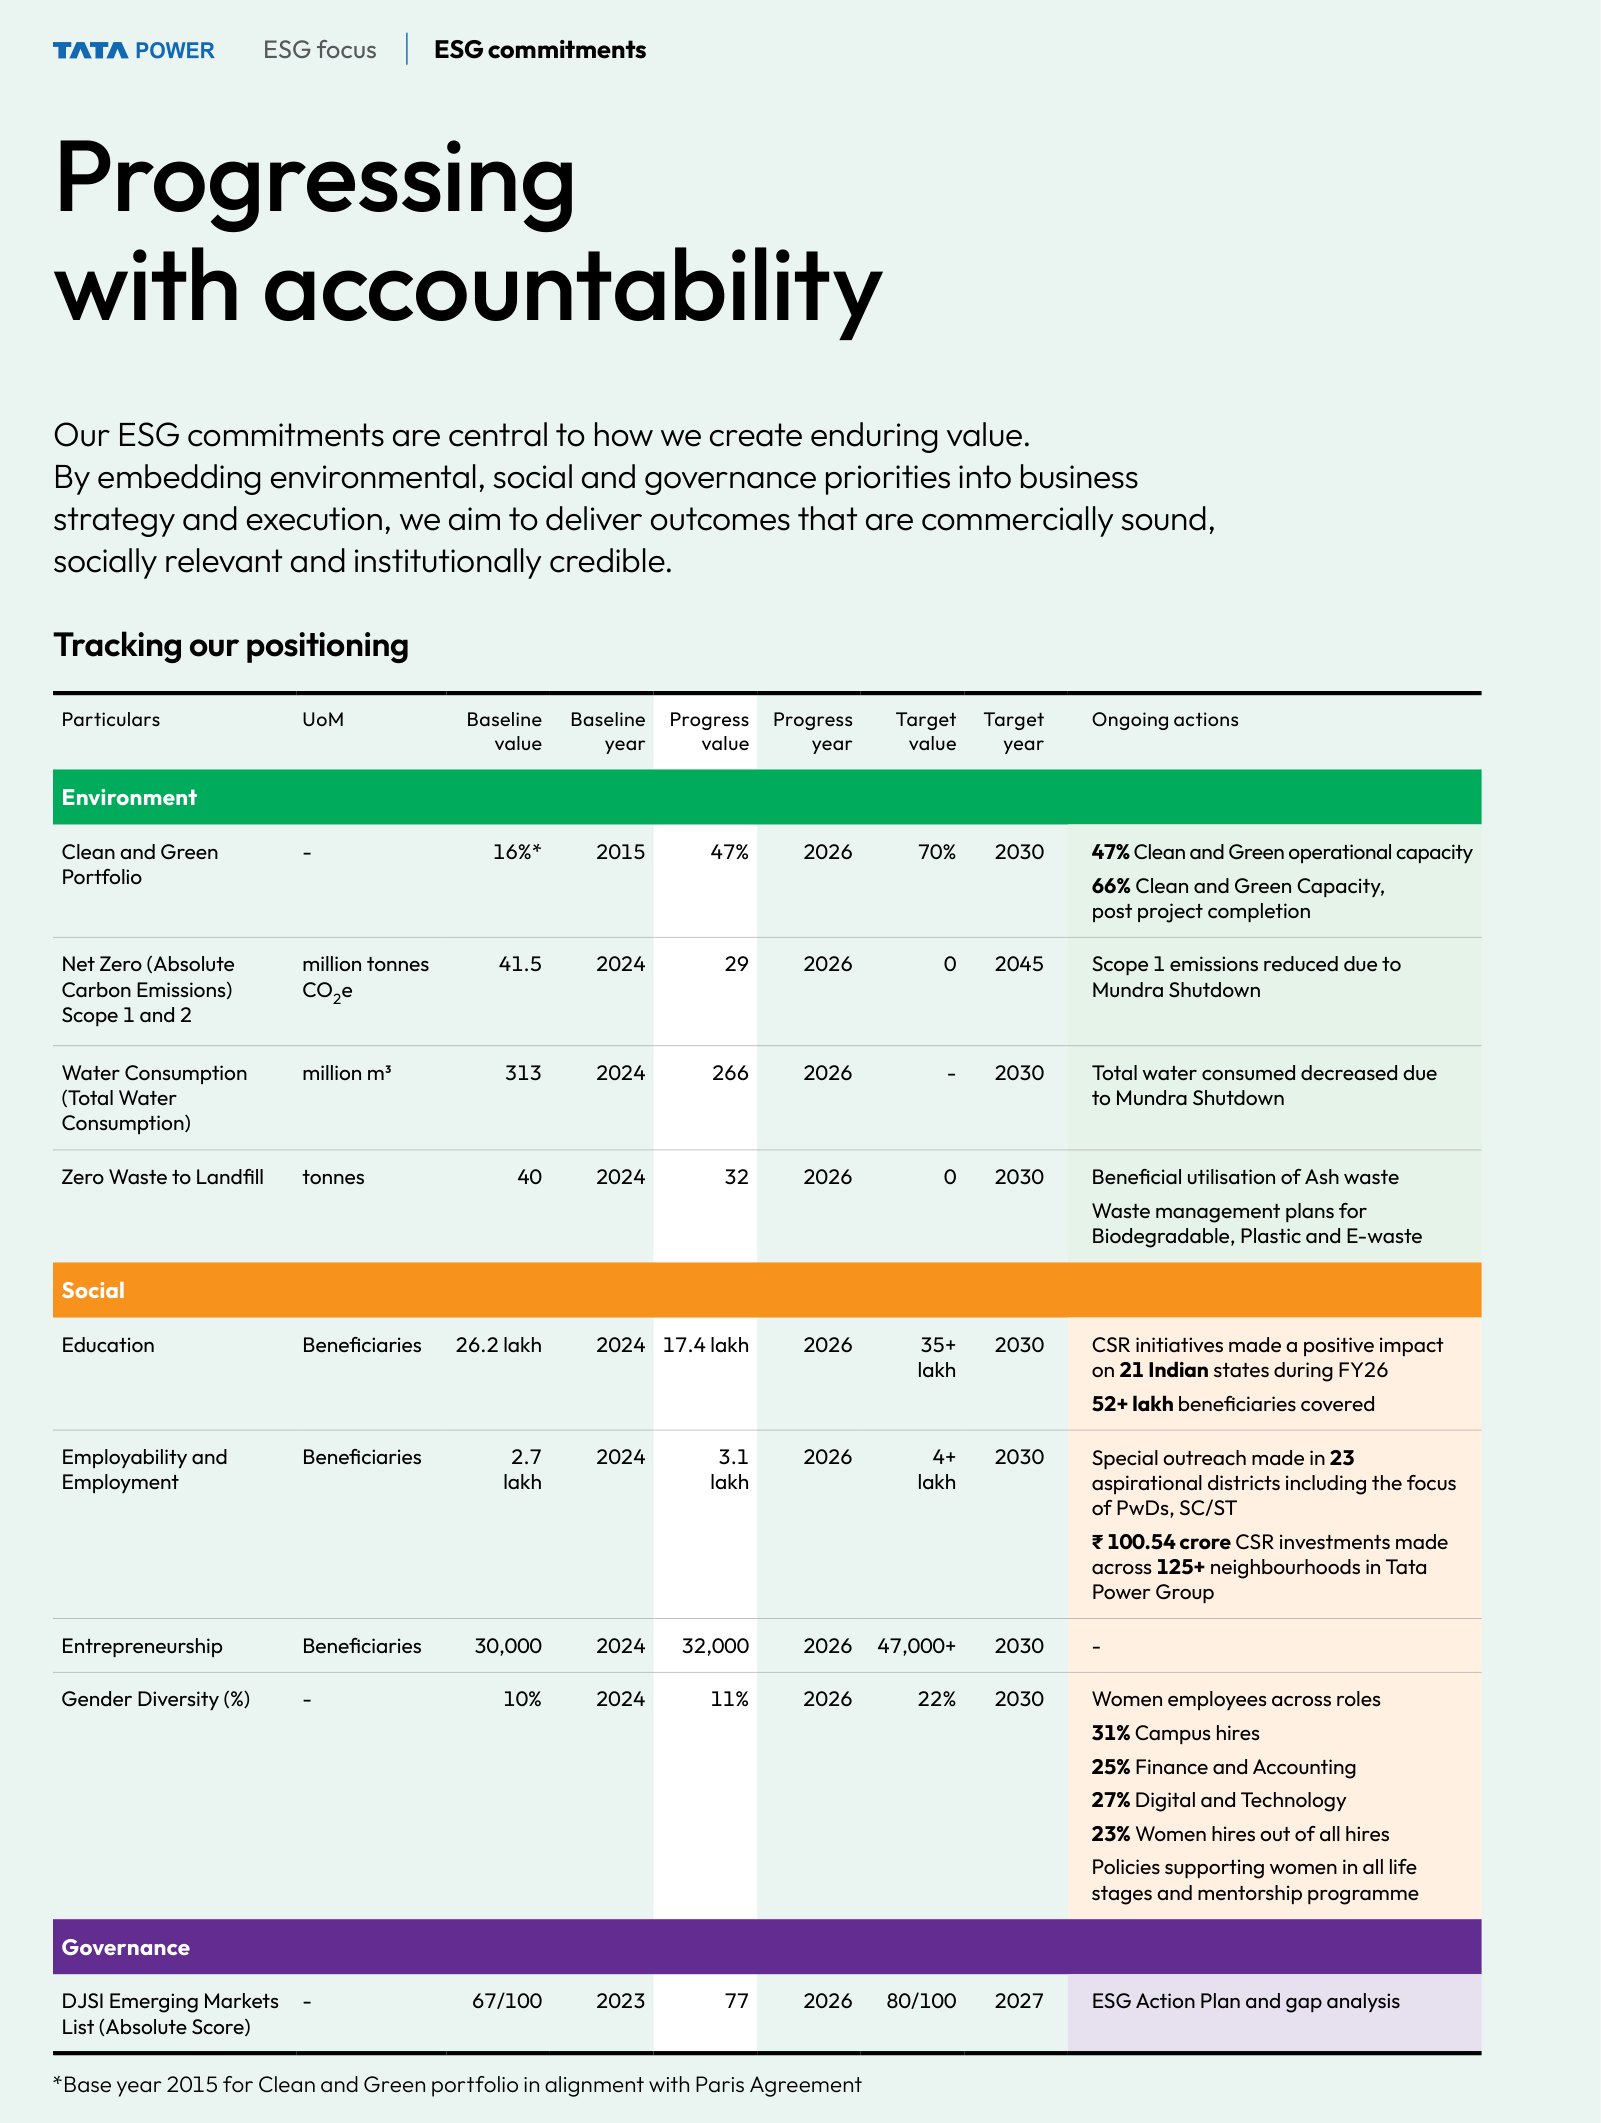
On BRSR and ESG integration, Stirrup's reports average 3.9 out of 5, second in our sample. The best single example is Tata Power's "Tracking our positioning" table. For each commitment it gives a baseline value and year, the FY26 value, the target and the target year, and what's being done about it.
It's honest in a way that's rare. The net zero row shows Scope 1 and 2 emissions falling from 41.5 to 29 million tonnes, and the note beside it says why: the Mundra shutdown, not a structural change. Gender diversity sits at 11% against a 22% target for 2030, which the table makes plain.
Saying the uncomfortable part
Candour was the weakest part of the narrative across all five agencies. Two Stirrup-credited reports were among the few that got it right.
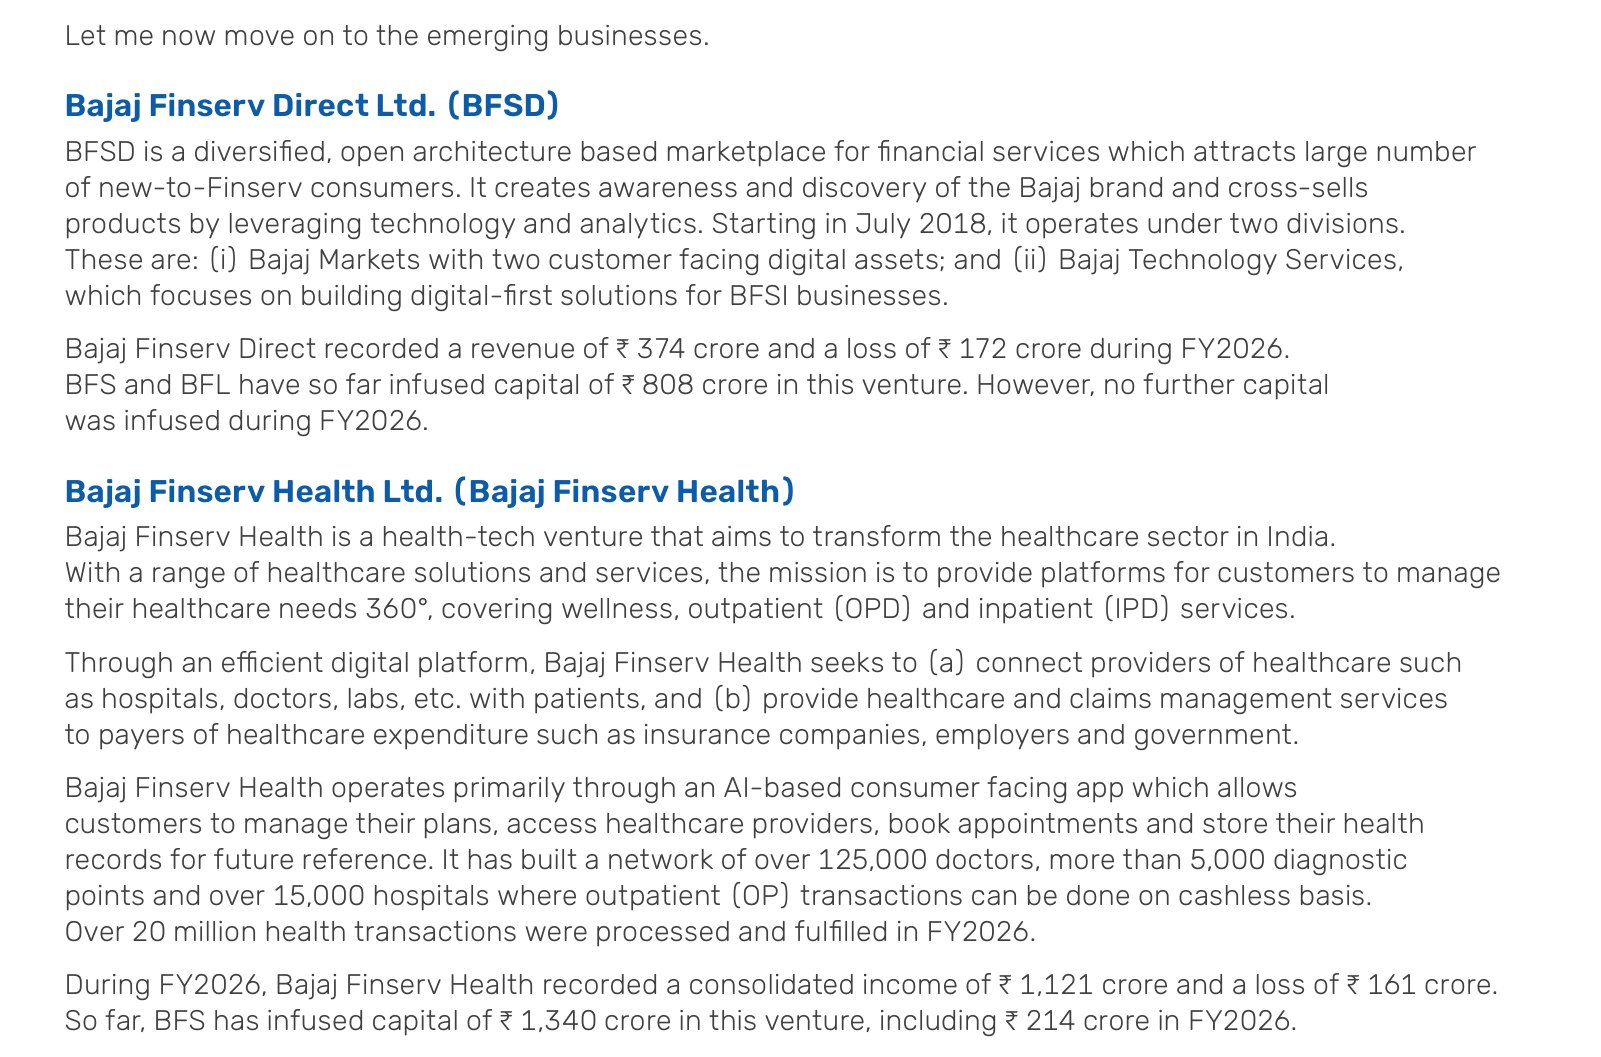
Bajaj Finserv's Chairman's letter doesn't stop at the profitable businesses. It walks through the emerging ventures as well, giving revenue and loss for each and how much capital has gone in so far. That's the kind of detail shareholders of a holding company need and rarely get in the front of the report.
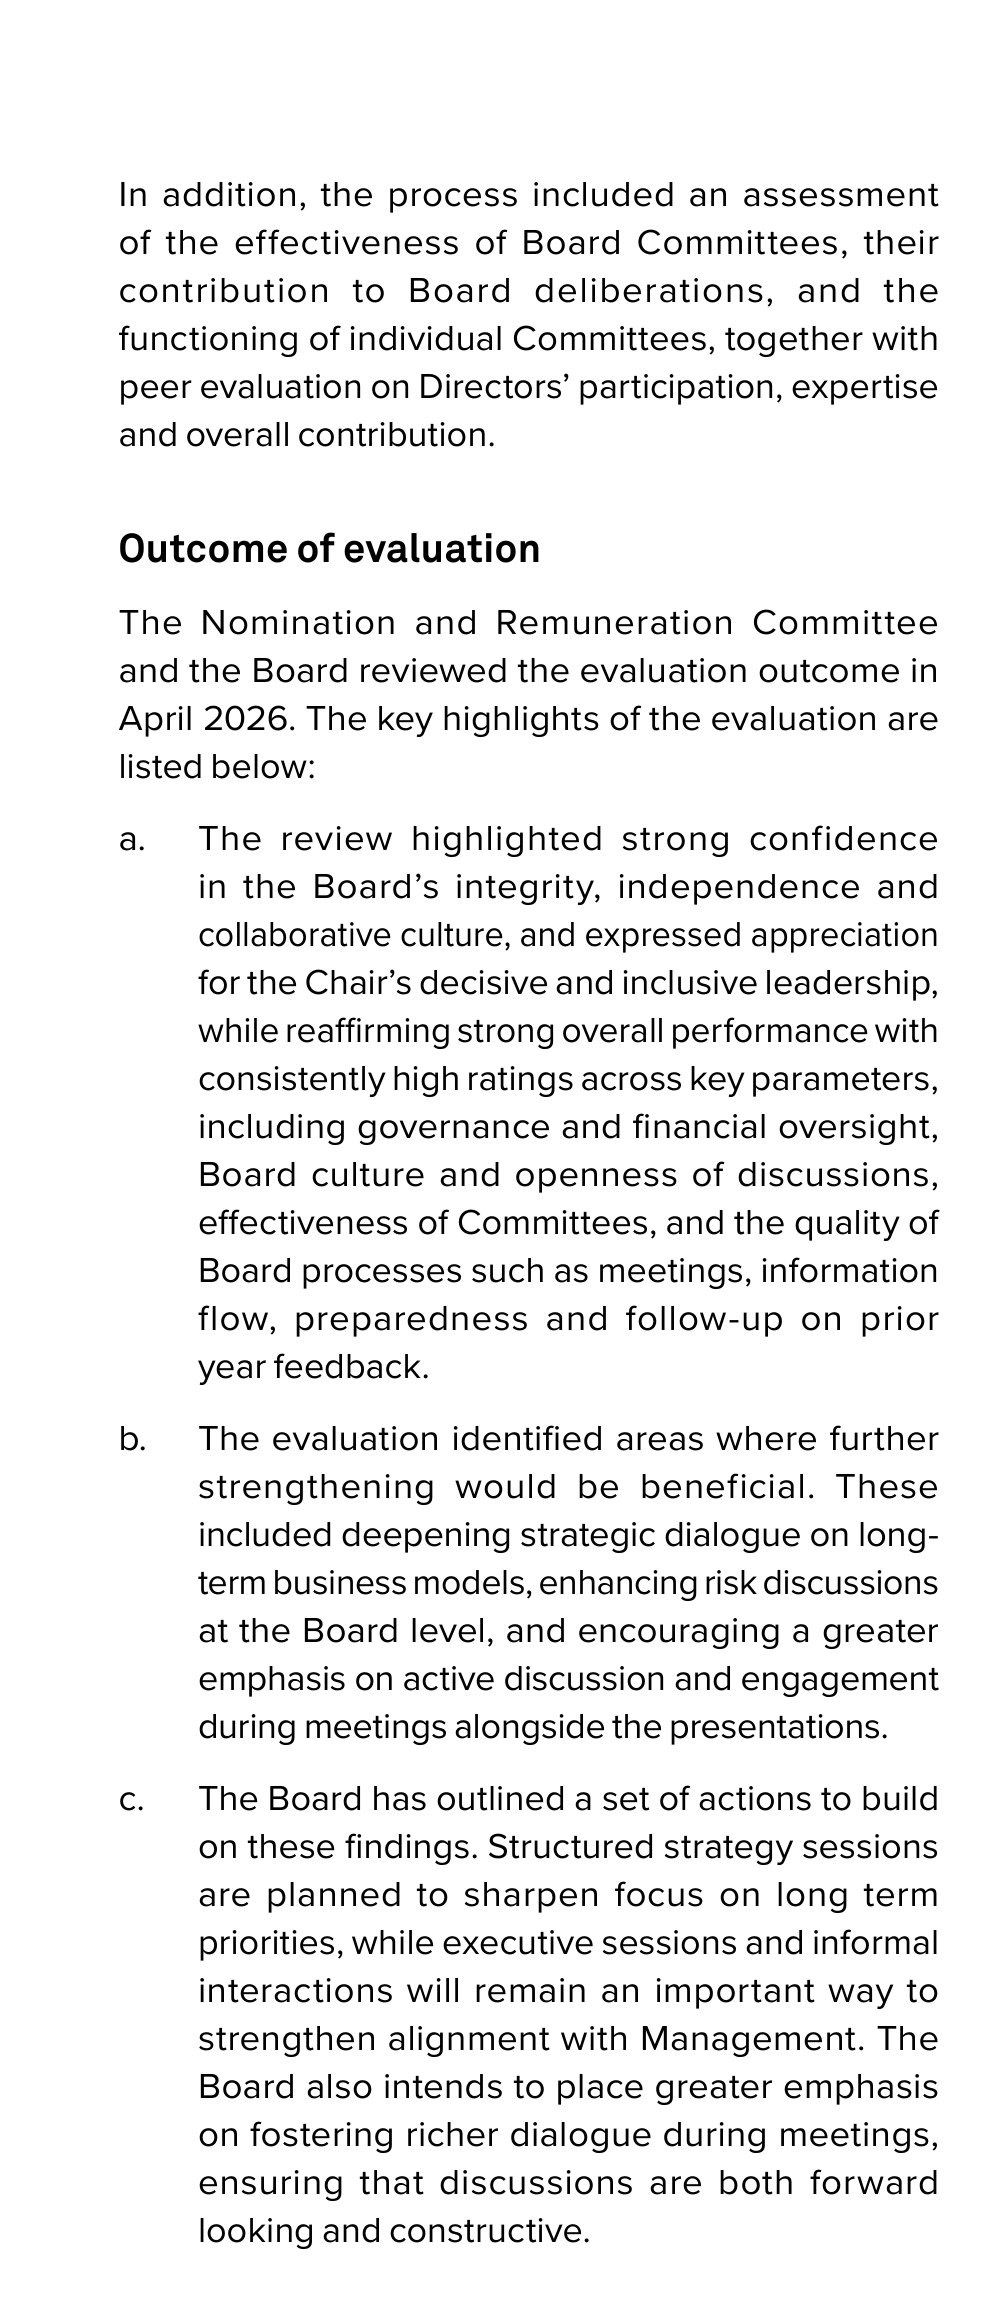
Wipro's board evaluation is one of a handful in our 35 reports that say what the evaluation found and what the board will do next. Most reports describe the process and stop. Wipro names three areas for improvement (strategic dialogue on long-term business models, risk discussion at the board, and more discussion alongside presentations) and the actions planned in response.
Where it's weaker
The digital version is a strange mix. Stirrup's reports have the highest digital average in our sample at 2.9 out of 5, and that's almost entirely down to online editions: five of the seven companies publish one (Ambuja Cements, Bajaj Finserv, Grasim, Tata Power and Wipro). WyattPrism's clients come next, with three. We don't know who built each one, though.
The PDFs are a different story. Six of the seven files have no bookmarks at all, which makes reports of several hundred pages hard to navigate on screen. Tata Power's has bookmarks, but they're production file names such as "Tata Power Board Report new Spread 10-6.pdf" rather than section titles. For most investors, the PDF on the exchange website is the report, so this matters more than it looks.
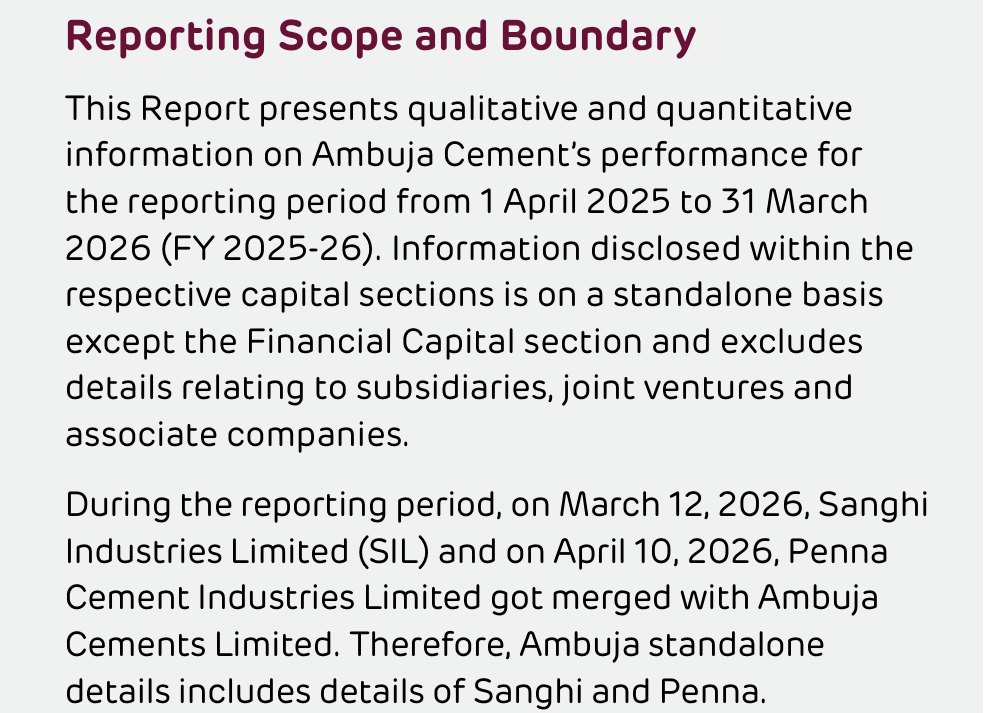
Dates and checks slip too, as they do for every agency we looked at. Ambuja Cements' scope note says that during the reporting period, which ended on 31 March 2026, Penna Cement merged with the company on 10 April 2026.
The other gap is format. Bajaj Finserv's conventional annual report scored 19, five and a half points below the integrated average, and Torrent Pharmaceuticals' integrated report, at 21, shows the structure alone doesn't guarantee the result. Still, the strengths above are mostly strengths of the integrated structure done well. Where a client doesn't adopt that structure, the report looks much more like everyone else's.
Who it suits
Judging only from these seven reports, Stirrup's work suits large companies that already publish an integrated report, or are ready to, and want the strategy, capitals and ESG pages to connect. Conglomerates and multi-business groups (Grasim, Tata Power, Bajaj Finserv) and heavy industry with real environmental numbers to report (UltraTech, Ambuja, Tata Power) are well represented. Its clients are also the likeliest in our sample to put the report online.
If you hire them, or anyone, write the PDF into the brief: bookmarks named by section, single pages, working links. And if your report is a conventional one, ask to see the integrated pieces before assuming they'll come with it.
The seven reports
| Company | Report | Credit wording | Score /35 |
|---|---|---|---|
| Grasim | Integrated report | Concept and design | 27 |
| Tata Power | Integrated report | Concept, content and design | 25 |
| UltraTech Cement | Integrated report | Concept, content and design | 25 |
| Wipro | Integrated report | Concept, content and design | 25 |
| Ambuja Cements | Integrated report | Concept, content and design | 24 |
| Torrent Pharmaceuticals | Integrated report | Concept, content and design | 21 |
| Bajaj Finserv | Annual report | Designed and produced | 19 |
Average per criterion, out of 5: strategy and narrative 3.6, integrated thinking 3.4, BRSR and ESG 3.9, governance 3.1, financial storytelling 3.3, design and readability 3.6, digital version 2.9. The full method, all 35 scores and how the other four agencies compare are in our annual report agency comparison.
Page references are to the PDF each company published. Several of these files mix single pages and spreads, so one PDF page may hold two printed pages.
Want your report rated?
If you'd like us to rate your annual report in the next round, send us a direct message on LinkedIn with your company name and the name of your annual report agency.
Frequently asked questions
Which annual reports did Stirrup design for FY2025-26?
Our sample of seven FY2025-26 reports credited to Stirrup includes Grasim, Tata Power, UltraTech Cement, Wipro, Ambuja Cements, Torrent Pharmaceuticals and Bajaj Finserv. Attribution comes from the credit printed in each report. It's a sample, not a full client list.
How good are Stirrup's annual reports?
On our seven-point card, the seven Stirrup-credited reports averaged 23.7 out of 35, with a median of 25 and a range of 19 to 27. That's second of the five agencies we compared. The six integrated reports averaged 24.5; the one conventional annual report scored 19.
What is Stirrup best at in annual reports?
Strategy and narrative, where its reports have the highest average in our sample, followed by integrated thinking and ESG: value creation models with numbers for each capital and ESG targets shown against progress. Its clients also publish more online editions than any other agency's in our sample.
Where are Stirrup's annual reports weaker?
The digital PDF. Six of the seven files have no bookmarks at all, and the seventh's bookmarks carry production file names. We also found a dating slip in Ambuja Cements' report, and the one conventional annual report in the sample, Bajaj Finserv's, scored 19 out of 35.
Does the credit mean Stirrup wrote the whole report?
Not necessarily. Most of the seven reports credit Stirrup with concept, content and design; Grasim's says concept and design and Bajaj Finserv's says designed and produced. We don't know the scope of each engagement, and much of any annual report is written and approved by the company's own finance, secretarial and audit teams.
Sources
- Stirrup Communication Consultants — Stirrup
- Which Annual Report Agency Does What Best? We Scored 35 Indian Reports — The Footnotes