
Design isn't decoration in an annual report. It decides whether a busy investor finds the answer in two minutes or gives up after twenty. Examples from Indian reports for 2025-26: covers, value creation models, KPI pages, ESG tables, governance and the digital file.
In this article
 In short
Key takeaways
- An annual report is read on screens and in pieces, not front to back, so design decides whether readers find what they're looking for.
- The best covers carry one idea in a few words, such as ICICI Bank's single word 'Empathy' or LTM's 'It's time to Outcreate'.
- A good value creation model shows the whole business on one spread, with real numbers for inputs, outputs and outcomes, as Dr. Reddy's, HUL and Tata Steel do.
- Numbers are easier to trust when they're shown over five or ten years, including the weak years.
- Design makes hard disclosures readable too: ESG targets set next to progress, and board skills shown as a grid.
- The digital file is part of the design. In our review of 35 reports, only nine had an online edition and many PDFs had broken or messy bookmarks.
Companies need to design their annual report because almost nobody reads it from start to finish. An investor, analyst or lender opens it on a screen, looks for a few answers and closes it again. Design decides whether those answers are easy to find, easy to understand and easy to trust.
That matters more each year. A large Indian annual report now runs to 300 to 600 pages, and some go well past 800. Since SEBI changed LODR Regulation 36(1)(b) in December 2024, shareholders without a registered email address get a letter with a web link instead of a printed abridged report. So more people read the report as a PDF, often on a phone.
Good design isn't about making the report look expensive. It's about helping a busy reader. Here's what that looks like in India's 2025-26 reports.
Who reads an annual report, and how
The readers are a mixed group: institutional investors and analysts, retail shareholders, lenders and rating agencies, regulators, journalists, job candidates, and employees. More and more, AI tools read it too, pulling figures into summaries and answers.
Few of them read in order. Most go straight to a handful of things: what the company does, the strategy, the year's numbers, the risks, governance and ESG. A designed report makes those easy to reach. An undesigned one makes the reader dig.
A cover with one idea
The cover is the first page every reader sees, and the best covers say one thing clearly. They give the year a theme in a few words, and the rest of the report builds on it.
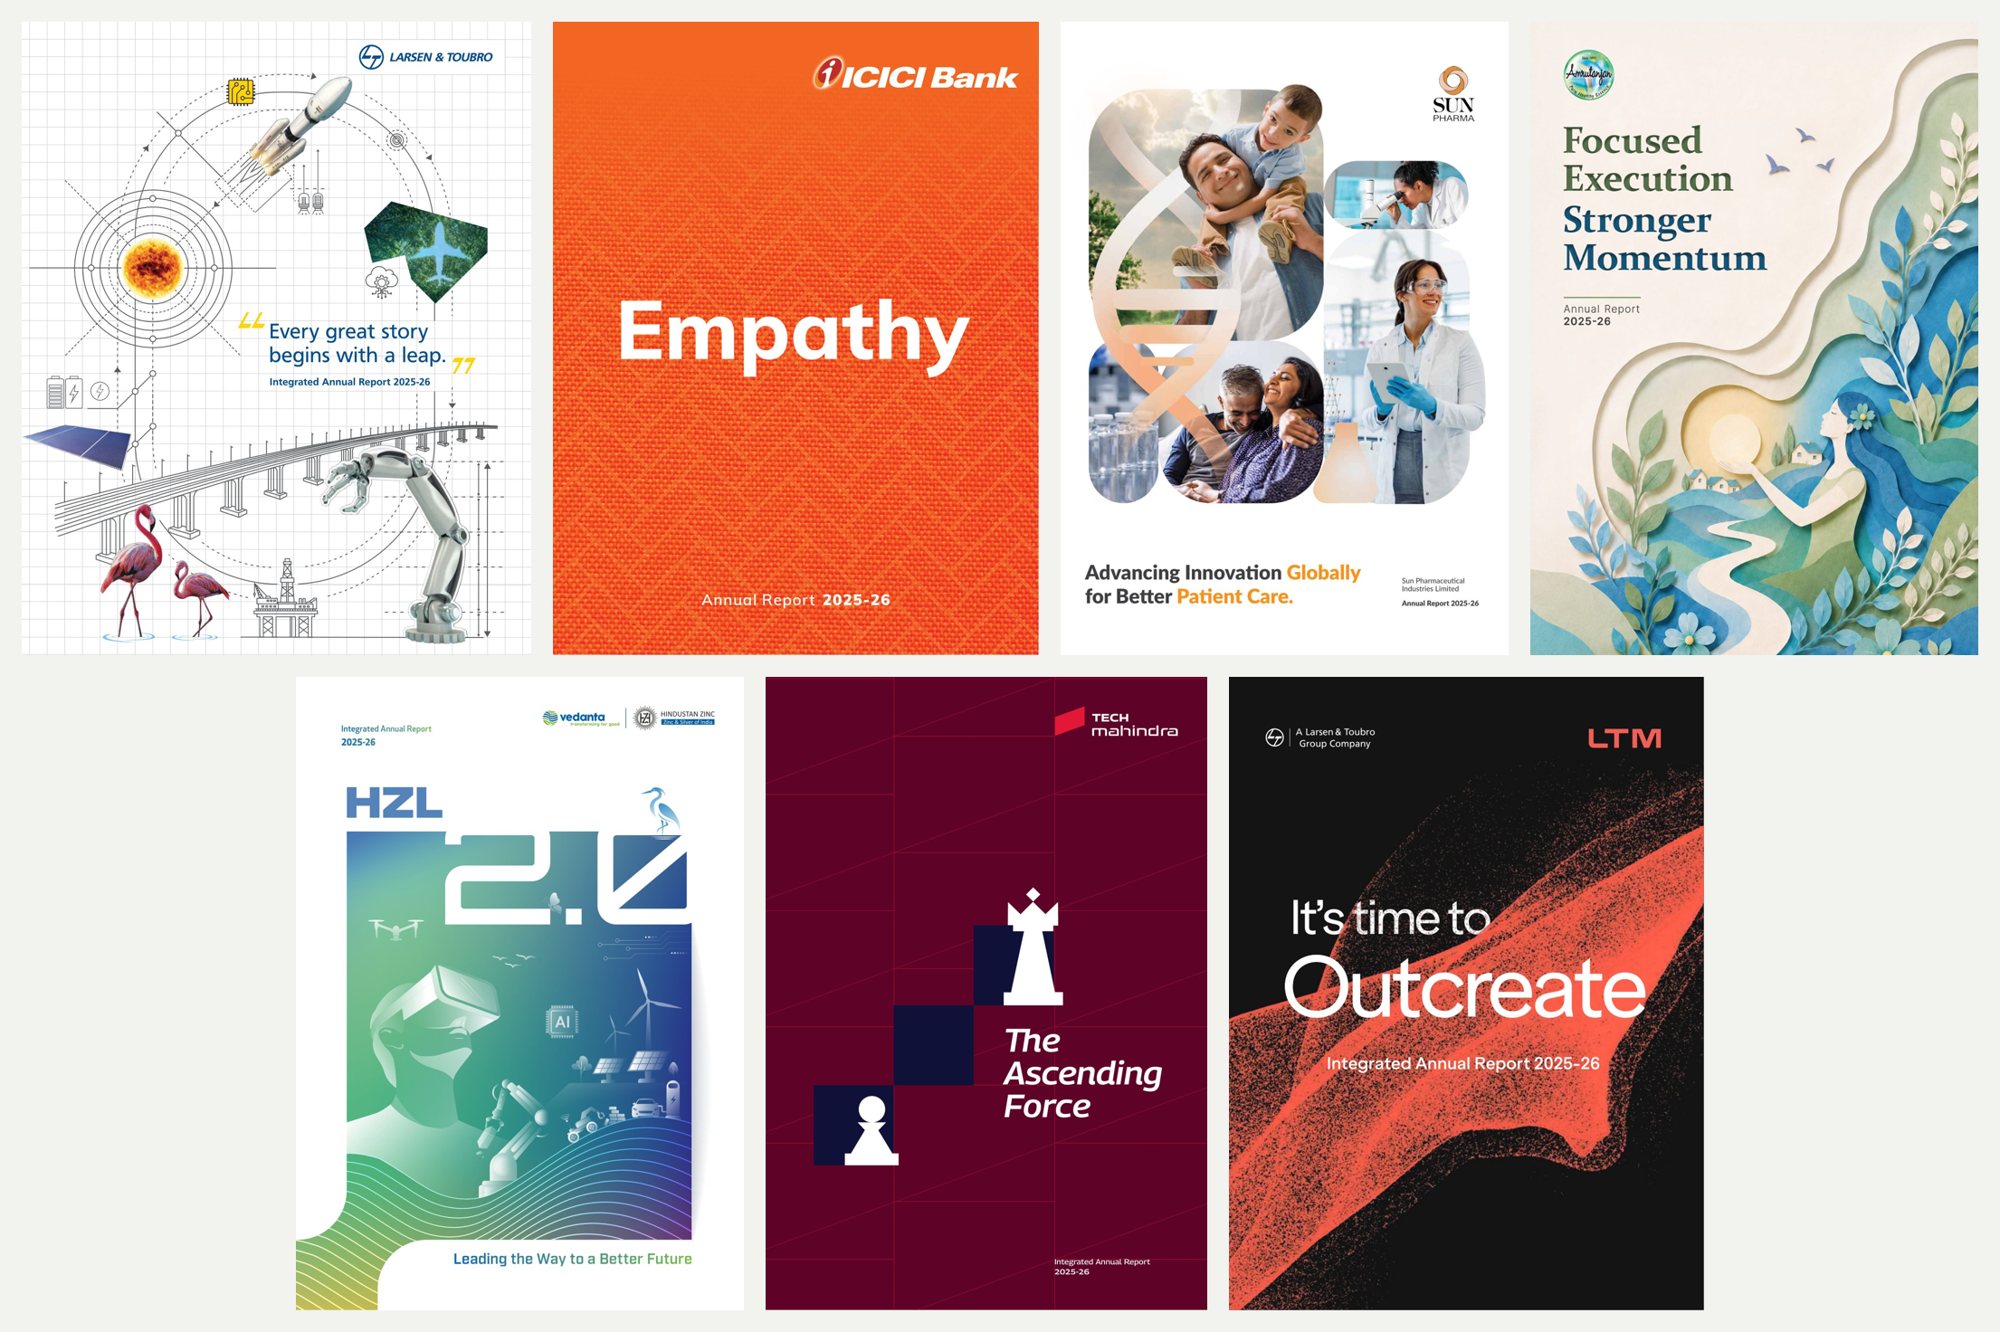
The approaches differ, but each cover makes one point:
- ICICI Bank uses a single word, "Empathy", on a solid orange background. There's nothing else to read.
- L&T pairs one line, "Every great story begins with a leap", with drawings of its businesses, from space to bridges to robotics.
- LTM uses three words, "It's time to Outcreate", and a bold red shape on black.
- Tech Mahindra uses a chess piece moving up the board for "The Ascending Force".
- Hindustan Zinc puts "2.0" at the centre, the name it gives its next phase of growth.
- Sun Pharma and Amrutanjan use photography and paper-cut illustration to carry their themes.
A cover like this does real work. It tells the reader what the company wants to be remembered for this year, and it gives the designers a theme to carry through every section.
The whole business on one spread
The value creation model is the page analysts and investors look for in an integrated report. It shows what the company puts in, what it does and what comes out. When it's done well, a reader understands the business in a minute.
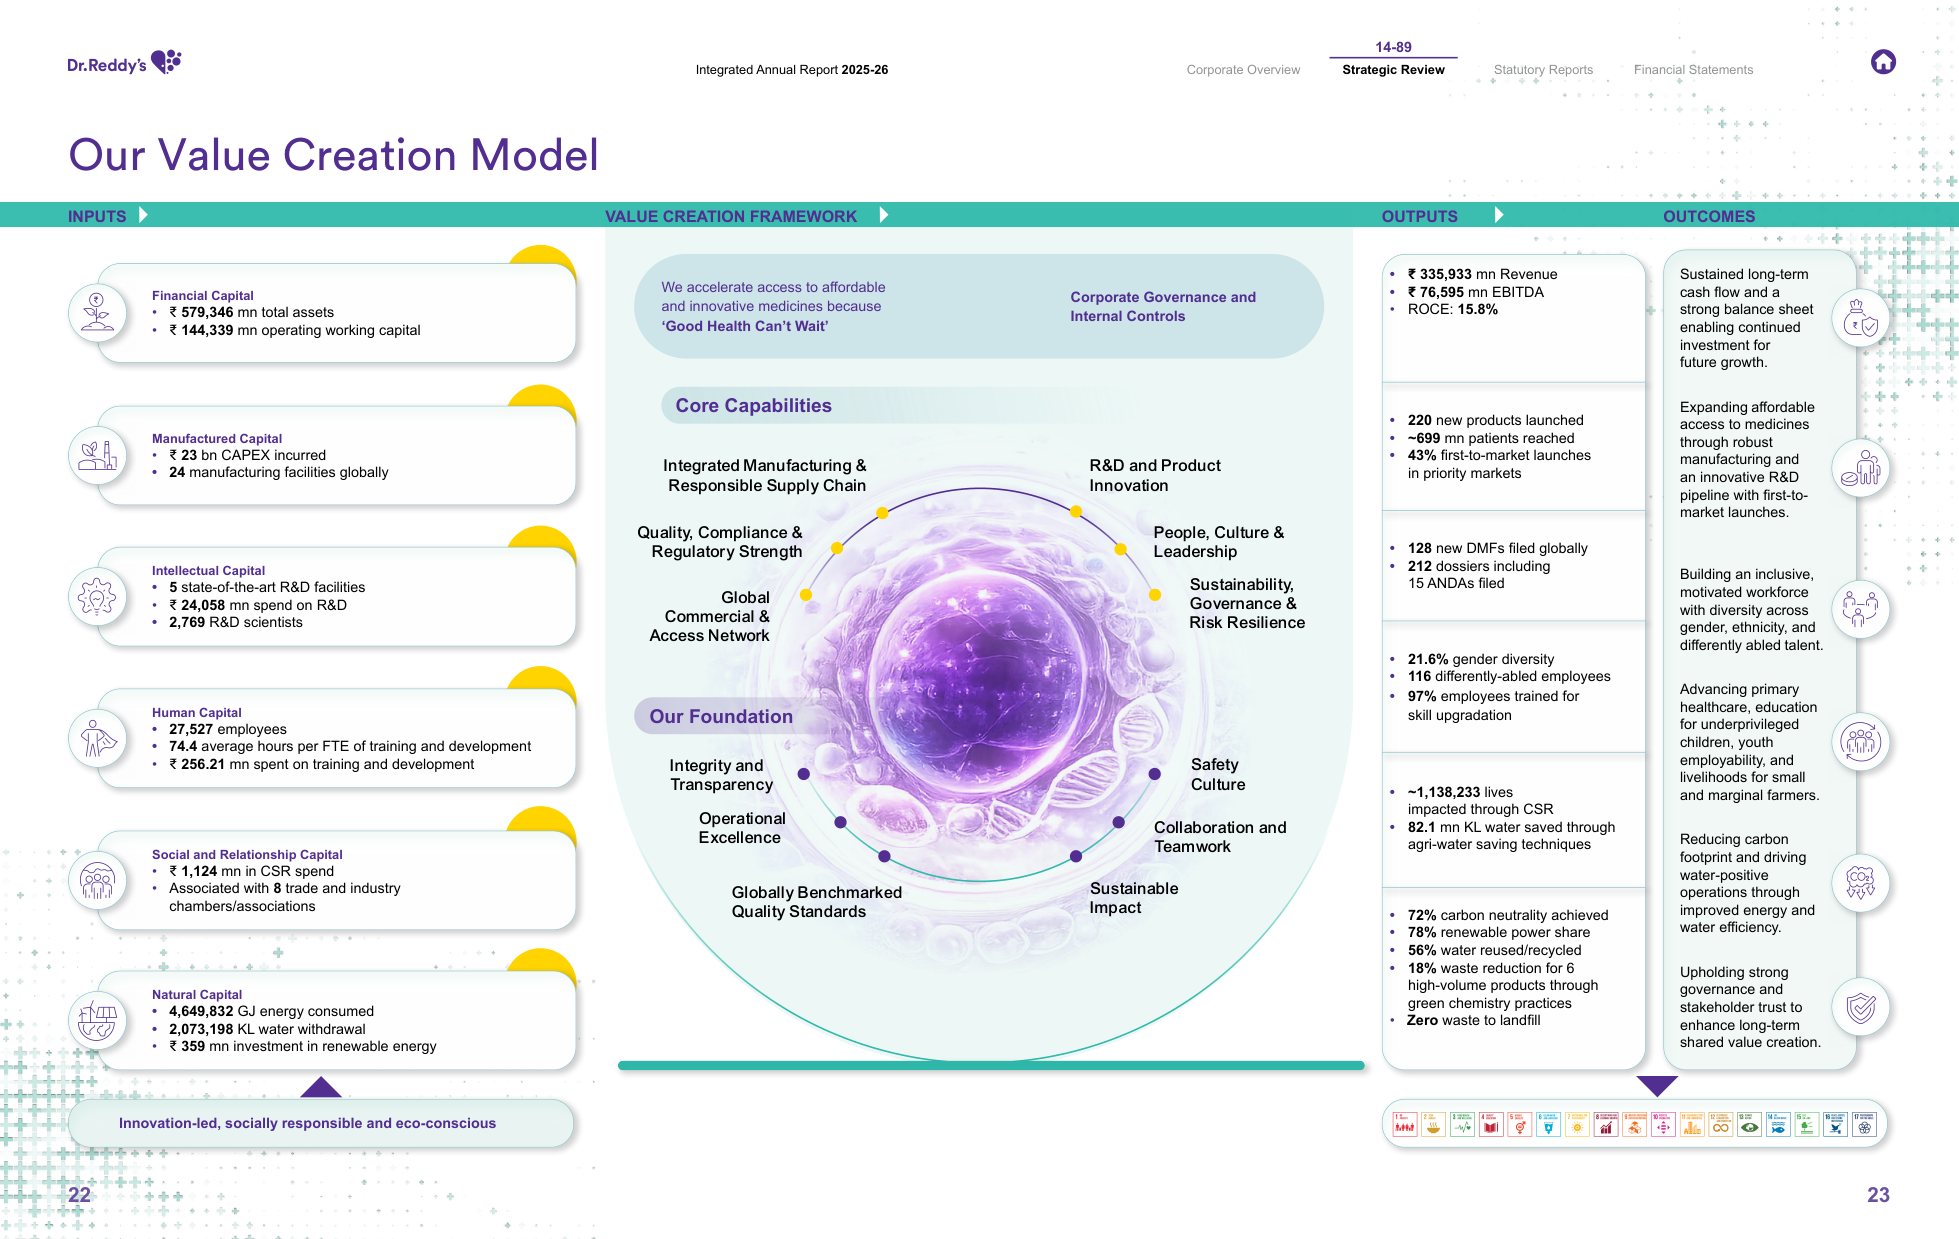
Dr. Reddy's lists each capital on the left with real numbers, such as ₹579,346 million of total assets and 27,527 employees. It then shows its core capabilities in the centre and the results on the right, starting with ₹335,933 million of revenue.
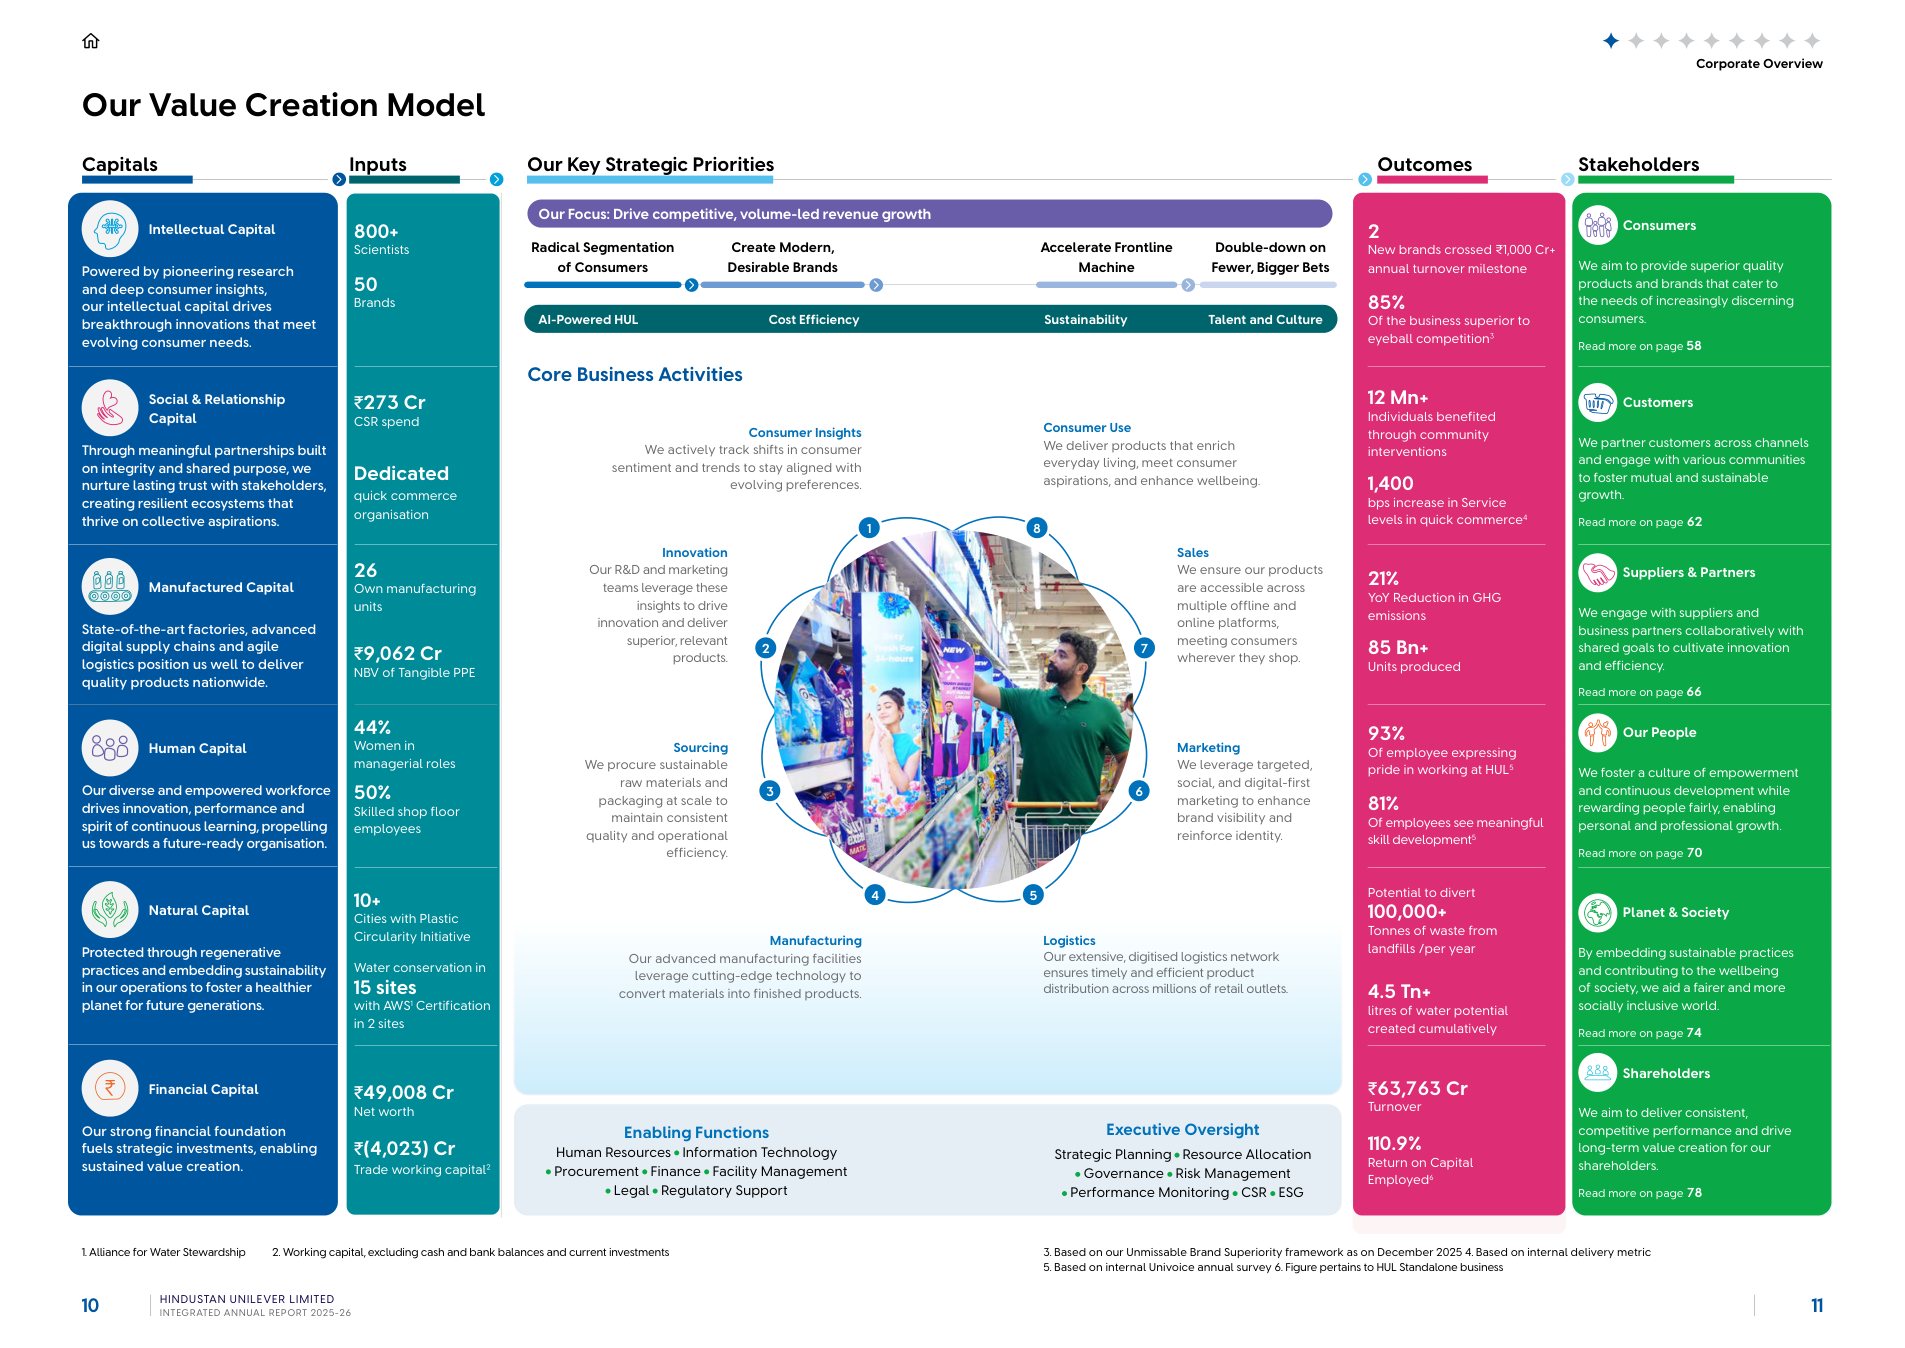
HUL gives each stage its own colour, from capitals to inputs, strategic priorities, outcomes and stakeholders. Each stakeholder box ends with "Read more on page…", so the spread also works as a map of the report.
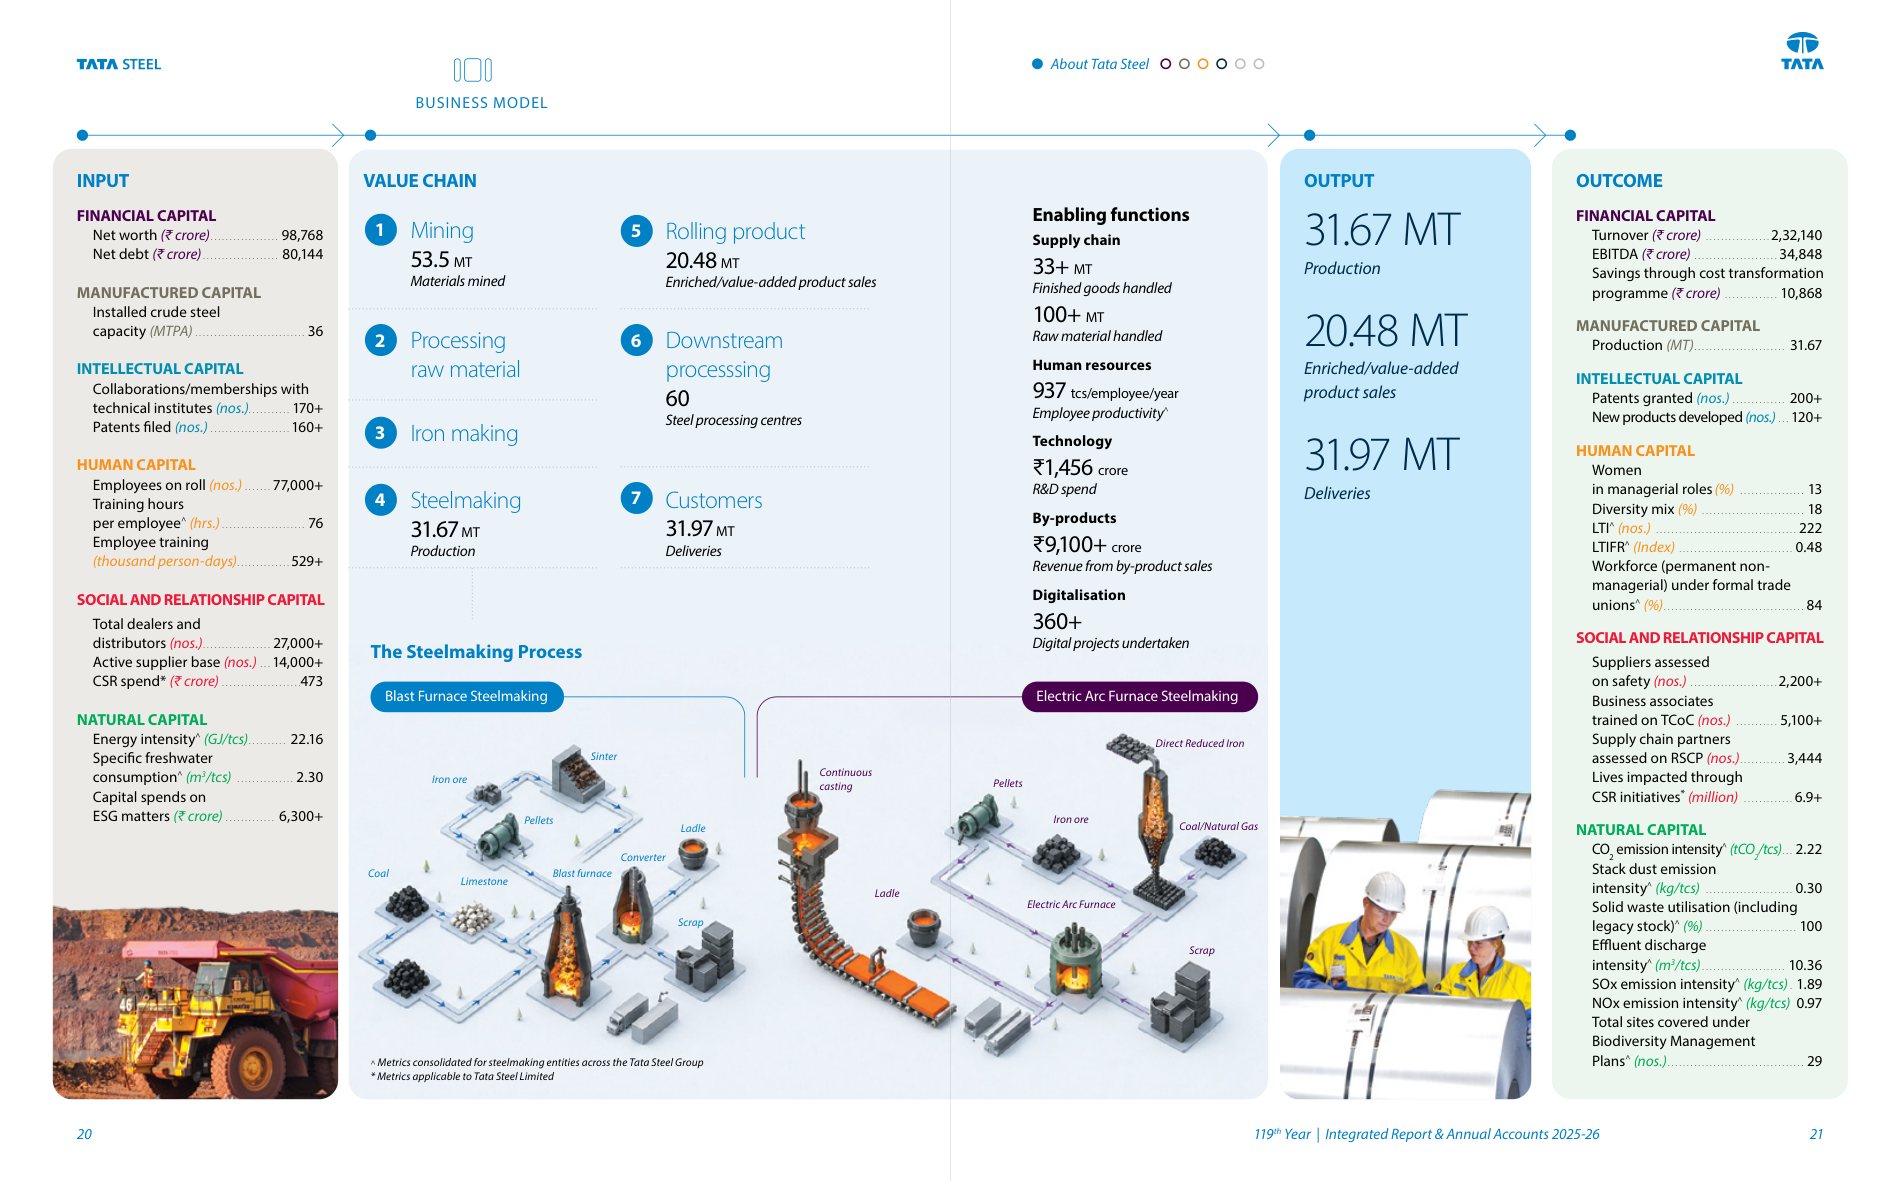
Tata Steel draws its value chain as the steelmaking process itself, from mining to customers, with both blast furnace and electric arc routes. The outputs sit in large type: 31.67 million tonnes produced and 31.97 million tonnes delivered.
All three share one habit. They give numbers at every stage, not just icons and labels. A model without figures looks the same for every company. A model with figures tells you about this one.
Numbers over time, including the bad years
A single year's results don't tell a reader much. Five or ten years show the trend, and a good chart makes that trend clear at a glance.
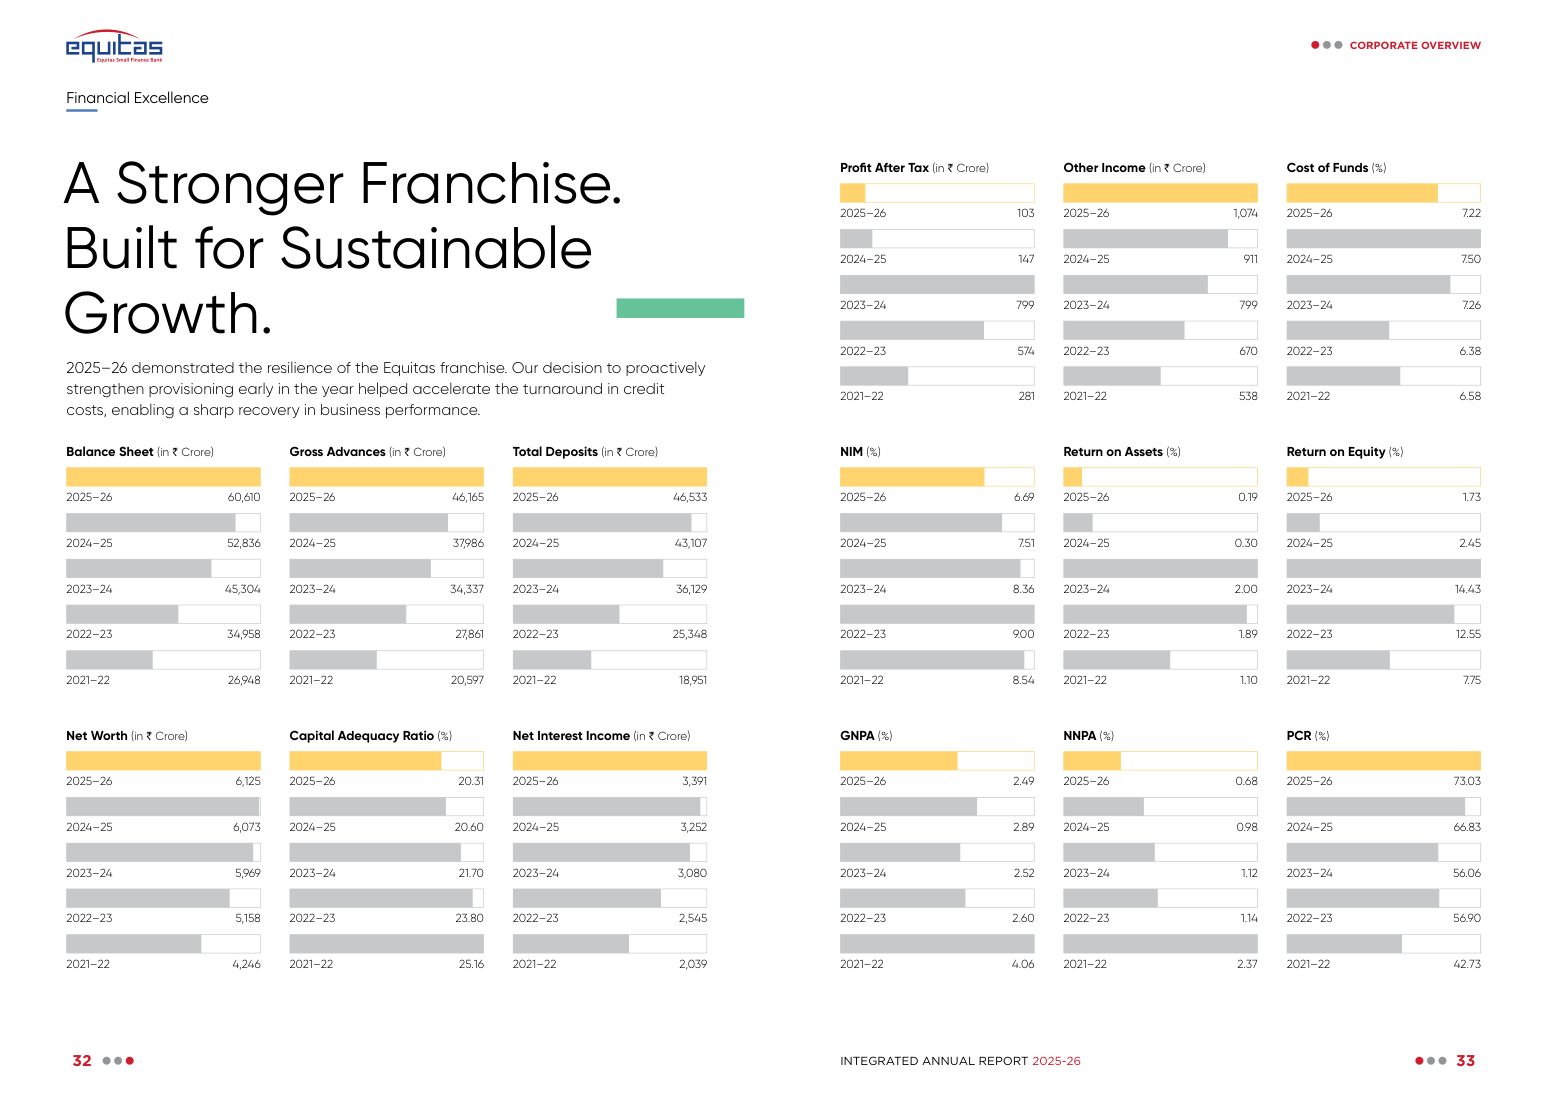
Equitas shows five years of bars for every key measure on one spread, with the current year highlighted. The weak years stay on the chart, which makes the strong ones easier to believe.
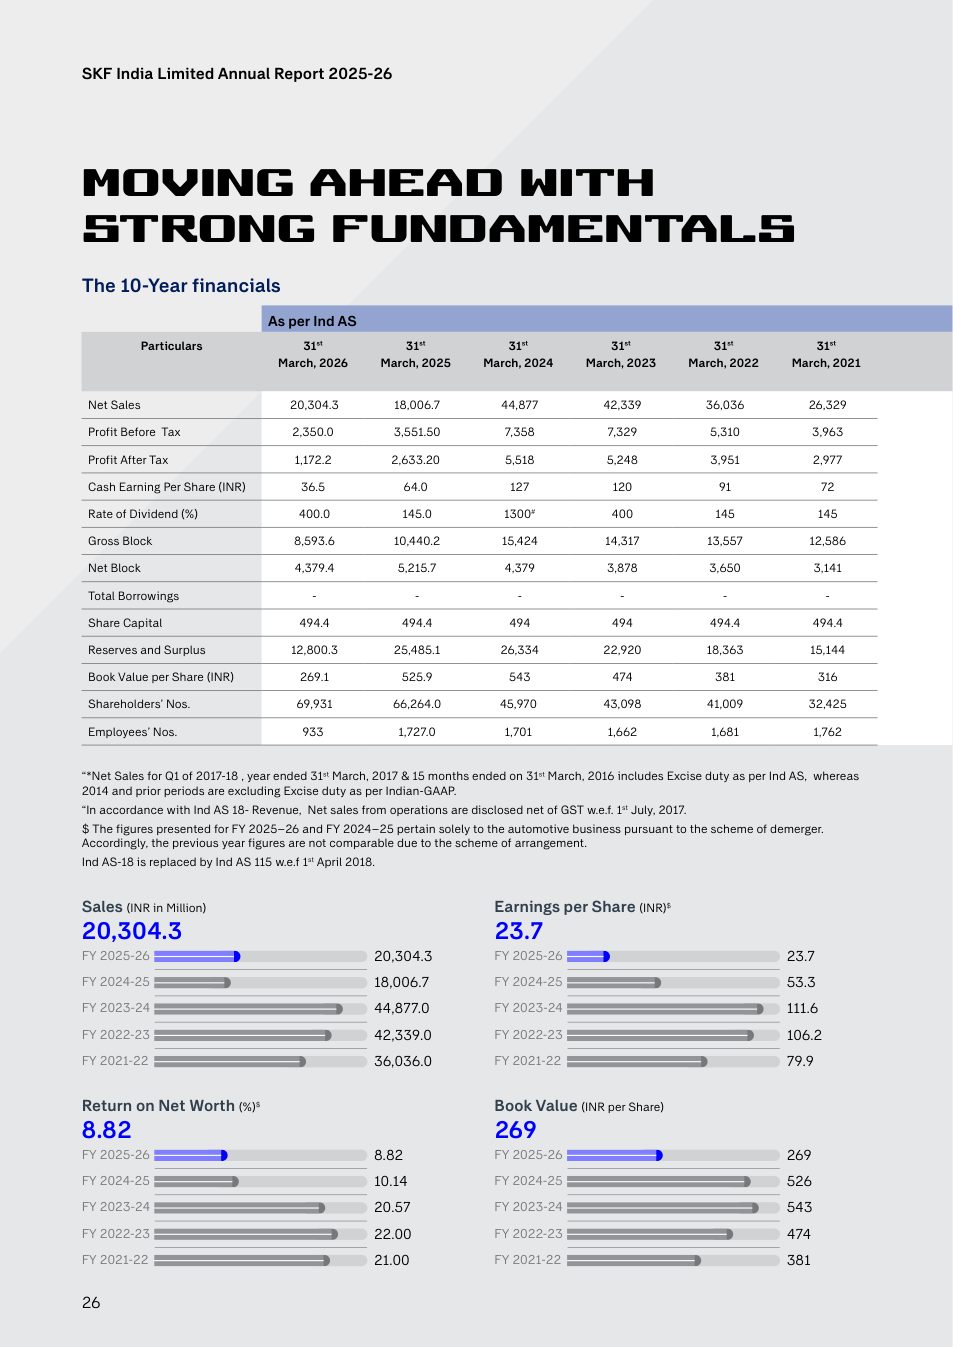
SKF India puts ten years of financials in one table and adds small charts underneath. A long-term investor gets the company's track record on a single page.
Hard disclosures made readable
Design isn't only for the glossy front section. Some of the most useful design work is on the pages that are hardest to read.
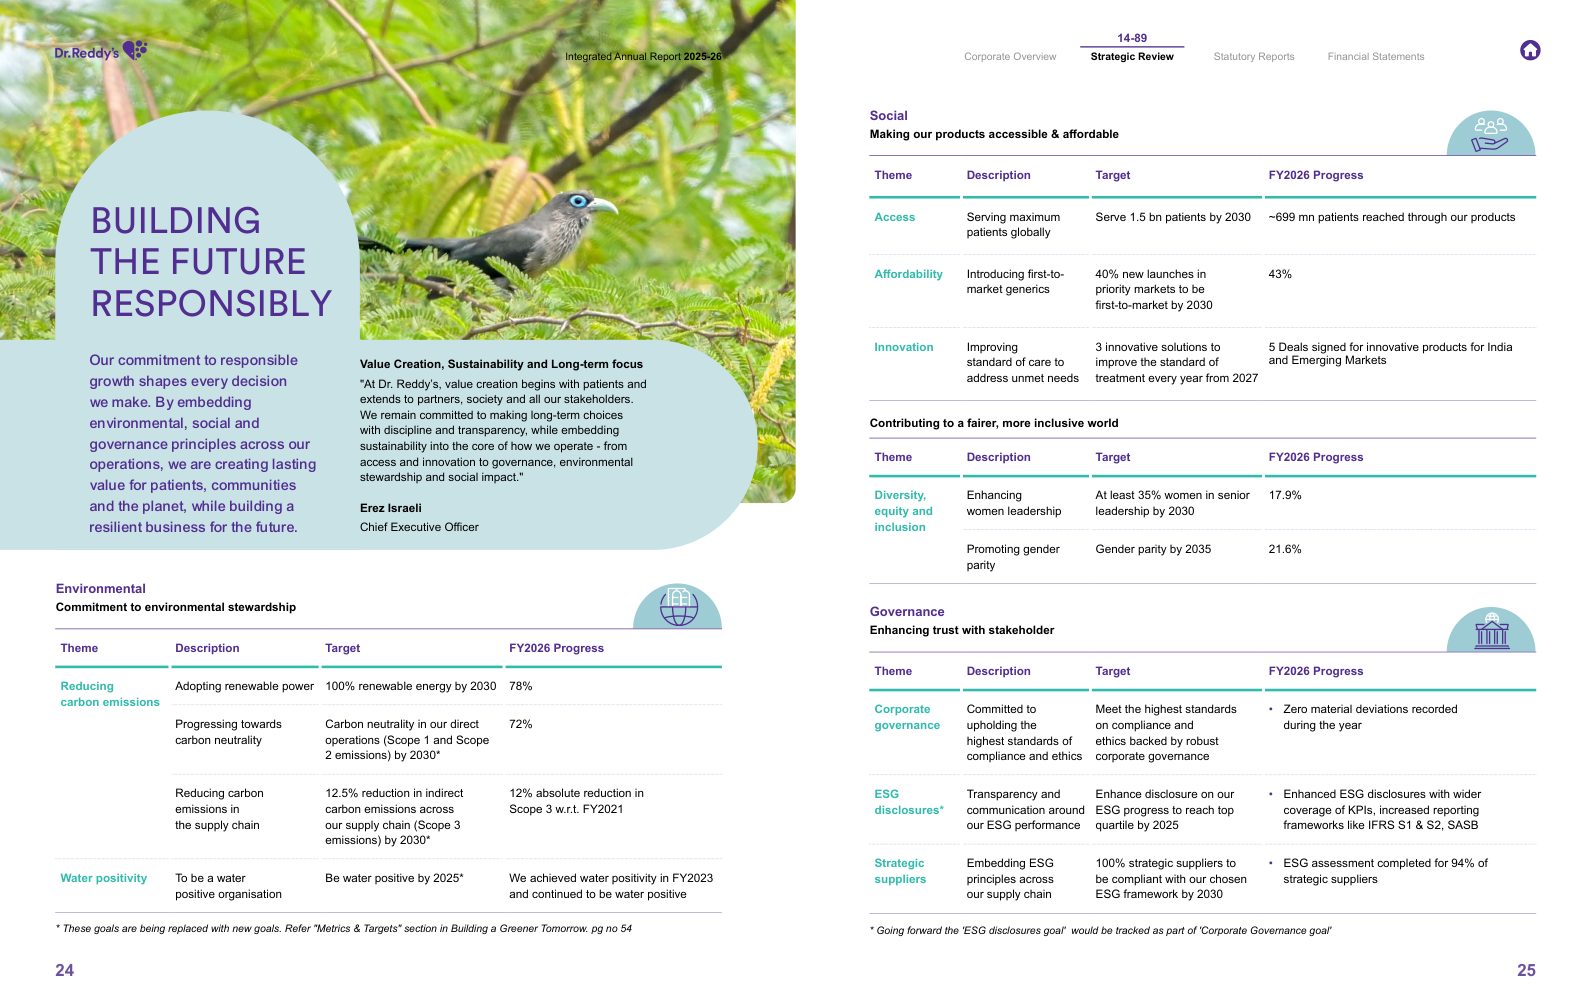
Dr. Reddy's sets each ESG target next to the progress made in FY2026, in one table. A reader doesn't have to match a target on one page with a figure fifty pages later.
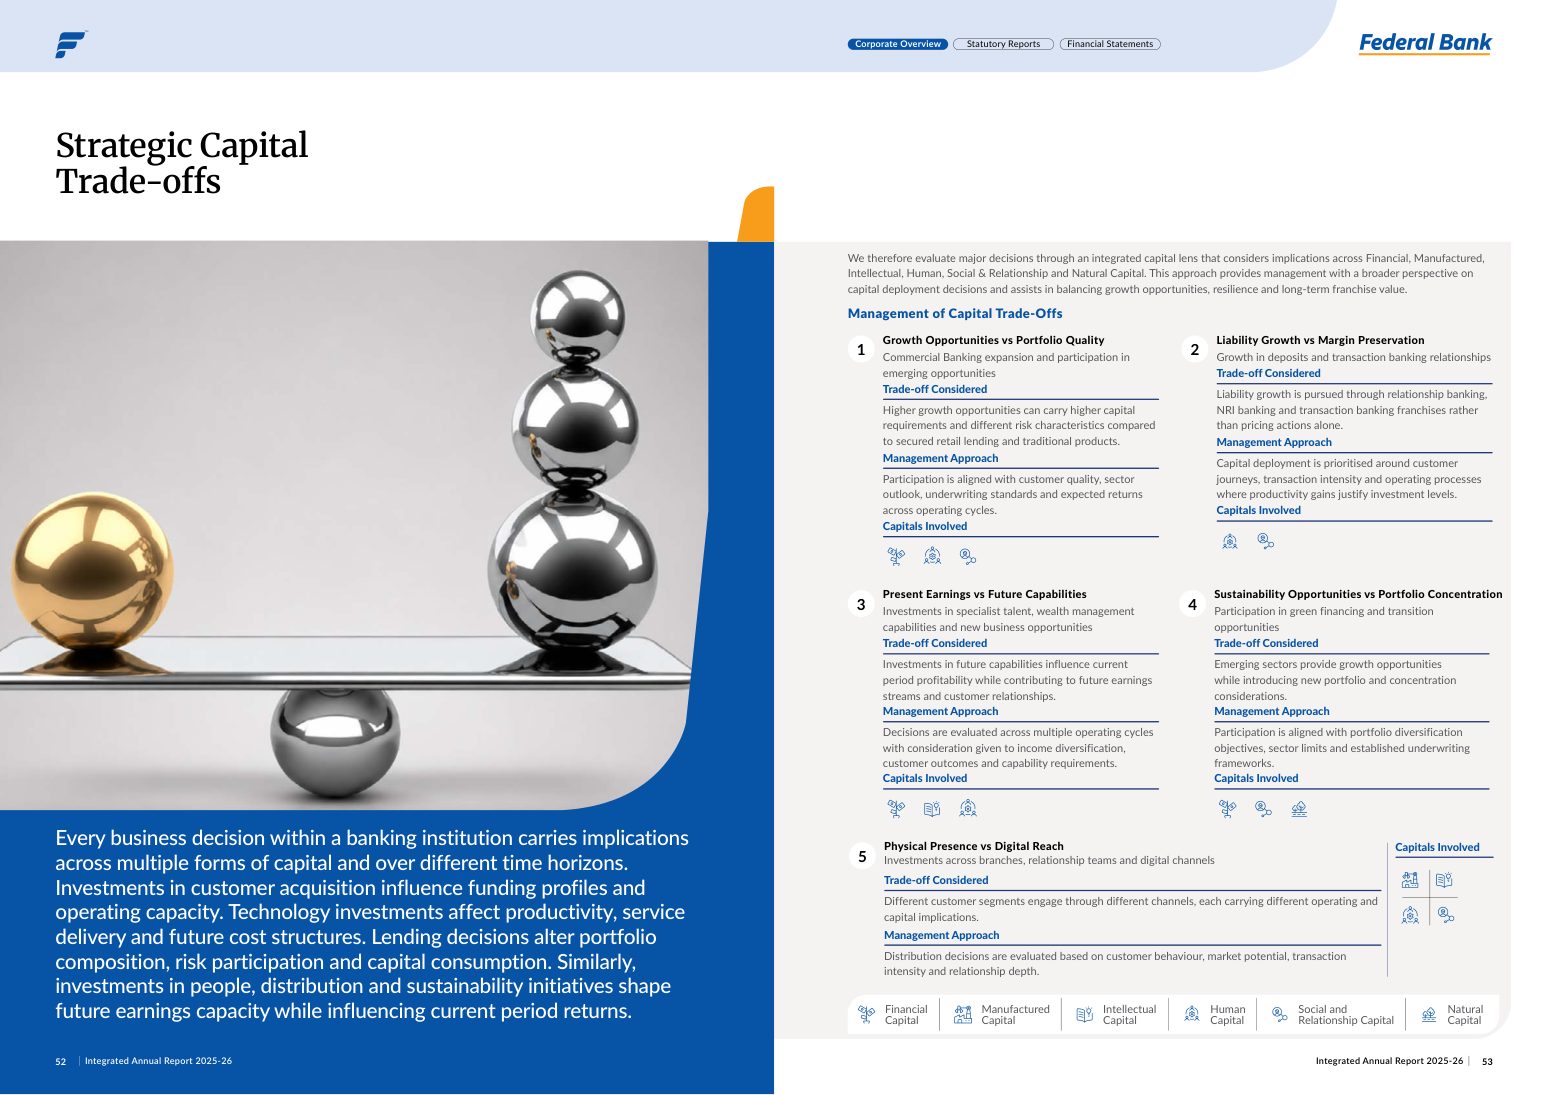
Federal Bank gives a full spread to trade-offs between capitals, an idea most reports skip because it's hard to explain. A strong image and a short summary make it approachable.
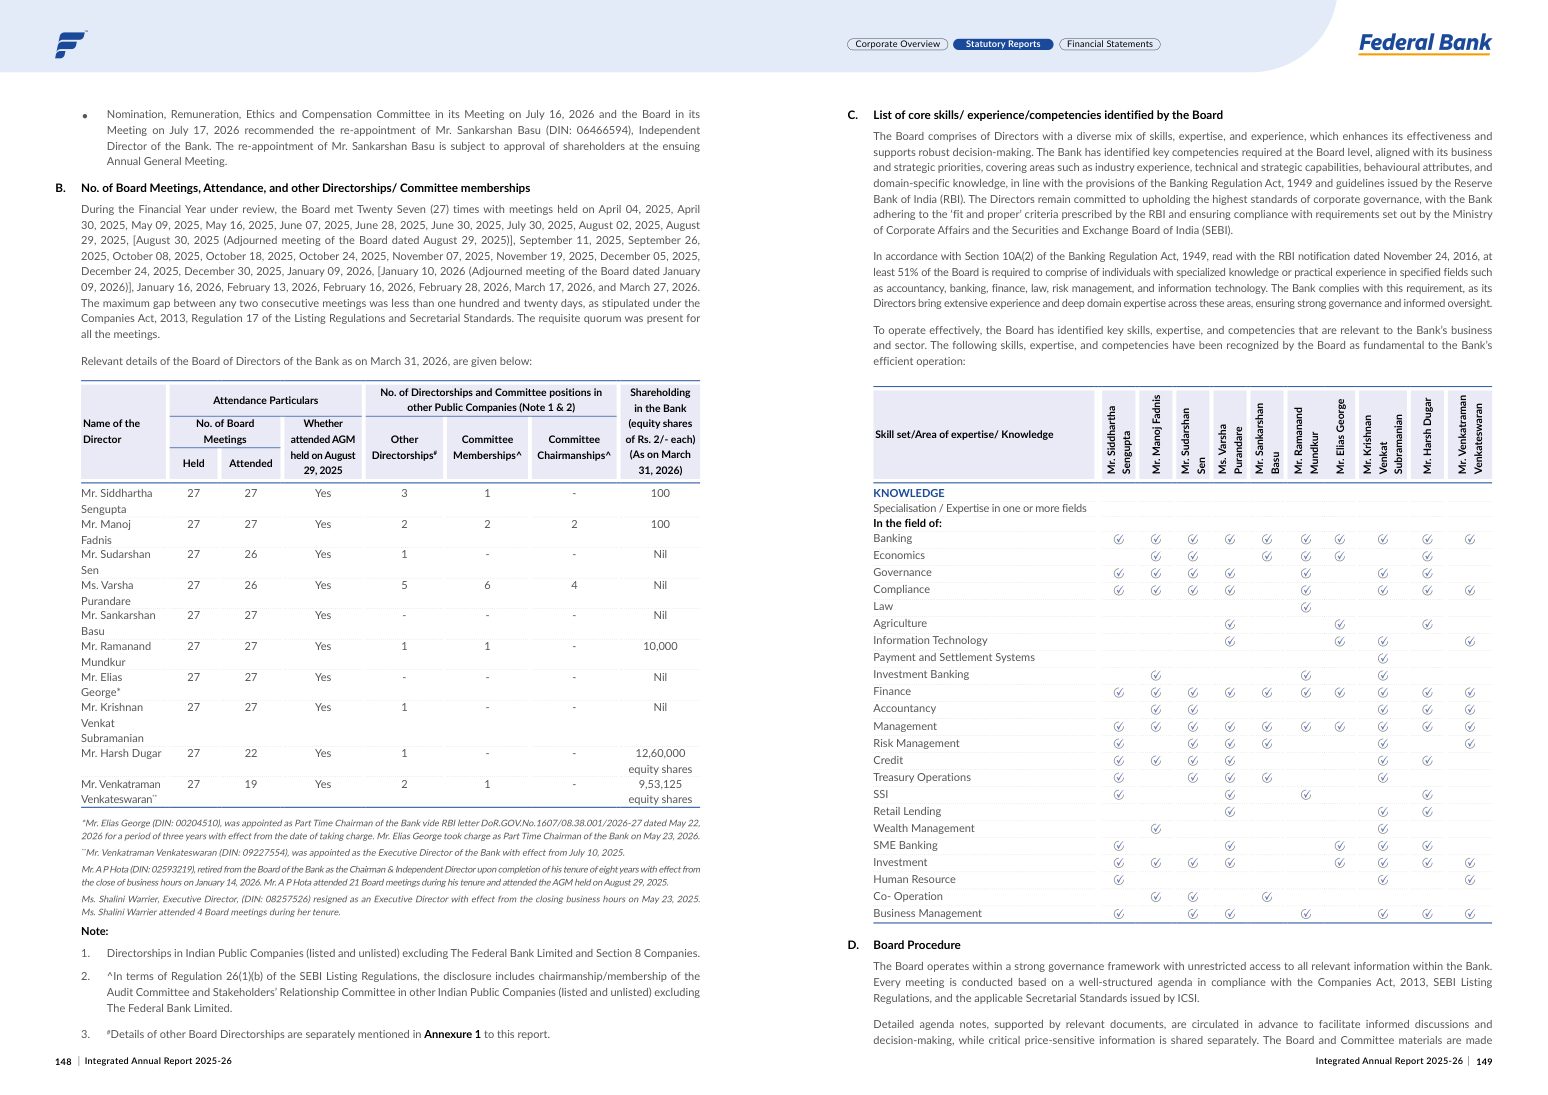
In its corporate governance report, Federal Bank shows board skills as a grid of directors and areas of expertise. A reader can see the board's strengths and gaps in seconds. Many reports describe the same information in paragraphs.
Where design usually stops
Most Indian annual reports have a designed front section and a plain statutory section. The Board's report, the corporate governance report and the notes to accounts often look like this:
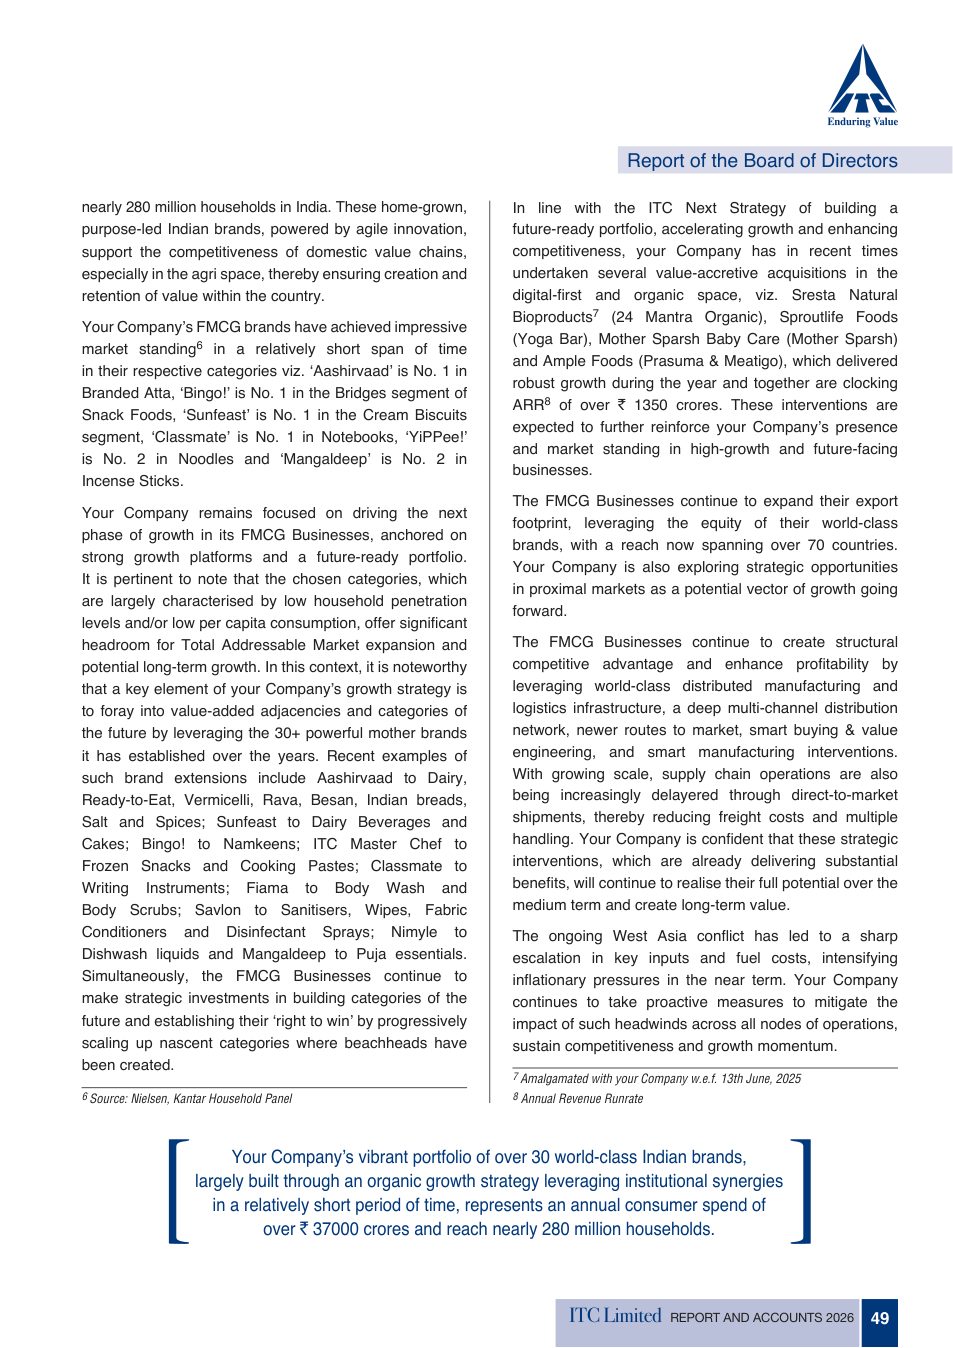
This page is clear and well set, and the highlighted quote helps. But the Board's report runs for dozens of pages in this style, and the statutory sections are where a lot of the detail readers need actually sits. Clear subheadings, short summaries at the start of each section, tables instead of long lists, and the same navigation as the front section all help.
The digital file is part of the design
The PDF on the stock exchange website is, for most readers, the report. Yet the digital file is where Indian reports are weakest. In our comparison of 35 reports, only nine had an online edition. Many PDFs had no bookmarks, bookmarks that showed production file names, or pages saved only as two-page spreads, which are hard to read on a phone.
The fixes are simple and cheap:
- Bookmarks with clean section names for every part of the report.
- A clickable contents page and a link back to it on every page.
- Single pages, or a single-page version alongside the spread file.
- Working links to the website, policies and the online edition.
Our guide to digital annual reports covers what a full online edition costs and what it adds.
In practice: before you sign off the final PDF, open it on a phone. Try to find the strategy, the five-year numbers and the BRSR in under a minute. If you can't, neither can an investor.
How to brief for design
Good design starts with the brief, not the layout:
- Pick one theme for the year and say it in a few words. Our guide to choosing an annual report theme can help.
- Decide the five things a reader must find, and place them early.
- Ask for numbers everywhere: in the value creation model, the capitals chapters and the KPI pages.
- Design the statutory sections too, not just the front.
- Write the digital file into the brief: bookmarks, single pages and links.
Design costs money, and our breakdown of annual report costs in India shows where it goes. But a 500-page report that nobody can find their way around costs more, in time lost and trust not earned. The best reports this year show that clear design is what makes all that work worth reading.
Frequently asked questions
Why is design important in an annual report?
Because most readers scan an annual report on a screen rather than reading it from start to finish. Investors, analysts, lenders and rating agencies look for specific answers: the strategy, the results, the risks and the ESG targets. Good design puts those answers on pages people find quickly, and makes numbers easier to compare and trust.
What makes a good annual report cover?
A good cover carries one clear idea in a few words and an image that supports it. It sets the theme for the whole report. ICICI Bank's 2025-26 cover uses a single word, 'Empathy', on a solid colour, while L&T's links one line, 'Every great story begins with a leap', to drawings of its businesses.
What should a value creation model show?
It should show the whole business on one spread: what the company puts in (its capitals, with numbers), what it does, what it produces, and the outcomes for stakeholders. The strongest examples, such as Dr. Reddy's, HUL and Tata Steel in 2025-26, give real figures at each stage rather than just icons and labels.
Does annual report design matter if most shareholders read it online?
It matters more. Since SEBI's December 2024 change to LODR Regulation 36(1)(b), shareholders without a registered email address get a letter with a web link instead of a printed abridged report, so more people read the report as a PDF or web page. That makes bookmarks, single-page layouts, working links and an online edition part of the design.
Is annual report design only about the front section?
No. The front section gets the most attention, but readers also use the Board's report, the corporate governance report, the BRSR and the financial statements. Clear tables, readable type, consistent headings and navigation in those sections are part of good design too.